Zip Codes with the Highest Percentage of Private Company Employees in Warren, OH
RELATED REPORTS & OPTIONS
Private Company Employees
Warren
Compare Zip Codes
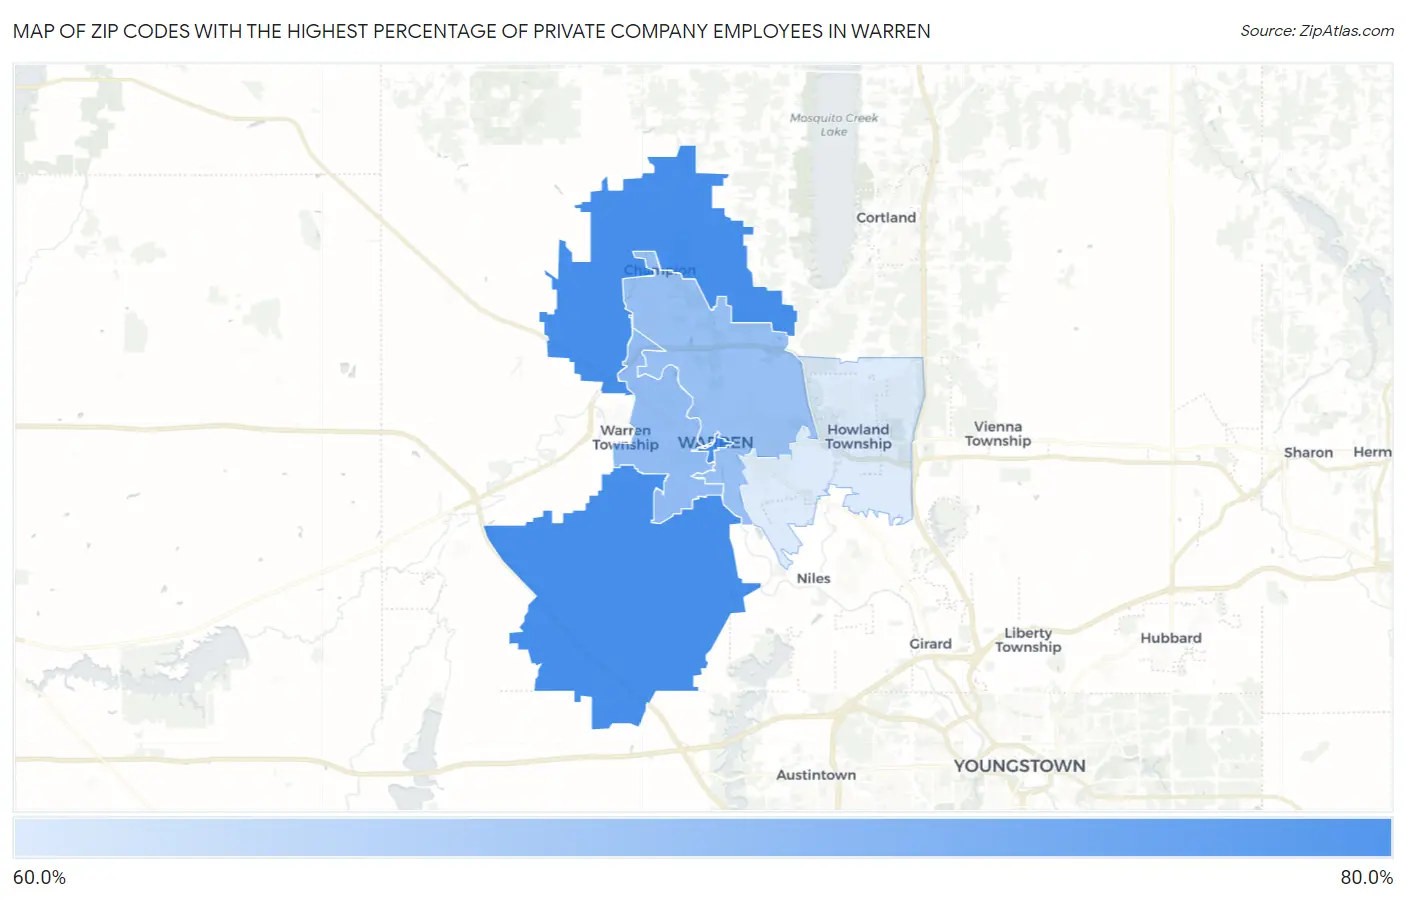
Map of Zip Codes with the Highest Percentage of Private Company Employees in Warren
65.5%
78.3%
Zip Codes with the Highest Percentage of Private Company Employees in Warren, OH
| Zip Code | % Private Company Employees | vs State | vs National | |
| 1. | 44481 | 78.3% | 69.5%(+8.86)#196 | 66.9%(+11.4)#2,938 |
| 2. | 44485 | 72.0% | 69.5%(+2.53)#519 | 66.9%(+5.10)#7,849 |
| 3. | 44483 | 71.4% | 69.5%(+1.94)#558 | 66.9%(+4.51)#8,573 |
| 4. | 44484 | 65.5% | 69.5%(-3.94)#895 | 66.9%(-1.37)#16,334 |
1
Common Questions
What are the Top 3 Zip Codes with the Highest Percentage of Private Company Employees in Warren, OH?
Top 3 Zip Codes with the Highest Percentage of Private Company Employees in Warren, OH are:
What zip code has the Highest Percentage of Private Company Employees in Warren, OH?
44481 has the Highest Percentage of Private Company Employees in Warren, OH with 78.3%.
What is the Percentage of Private Company Employees in Warren, OH?
Percentage of Private Company Employees in Warren is 72.4%.
What is the Percentage of Private Company Employees in Ohio?
Percentage of Private Company Employees in Ohio is 69.5%.
What is the Percentage of Private Company Employees in the United States?
Percentage of Private Company Employees in the United States is 66.9%.