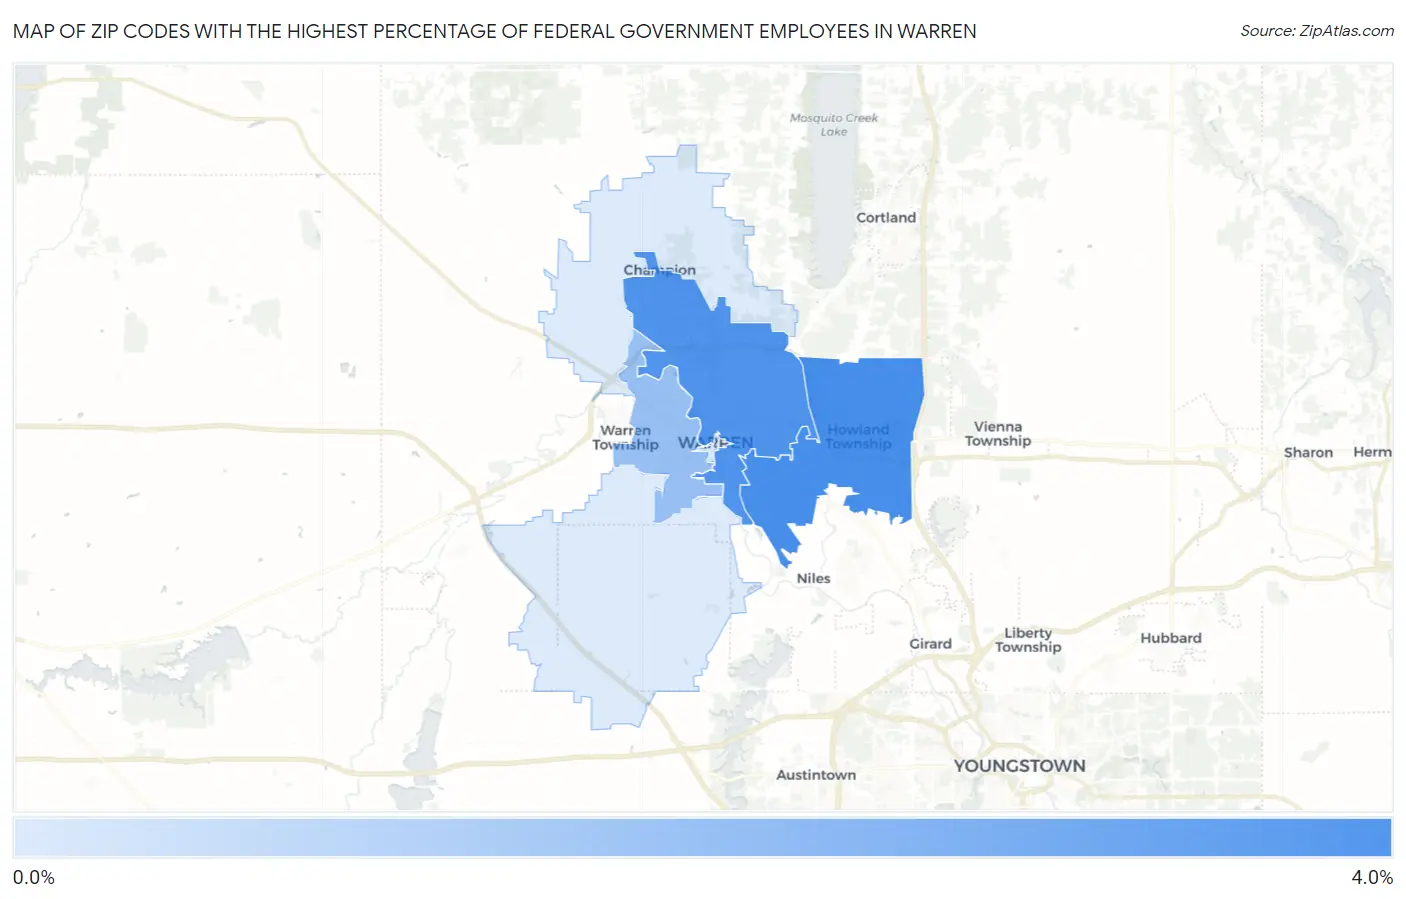
Zip Codes with the Highest Percentage of Federal Government Employees in Warren, OH
RELATED REPORTS & OPTIONS
Federal Government Employees
Warren
Compare Zip Codes
Map of Zip Codes with the Highest Percentage of Federal Government Employees in Warren
0.29%
3.5%
Zip Codes with the Highest Percentage of Federal Government Employees in Warren, OH
| Zip Code | % Federal Government Employees | vs State | vs National | |
| 1. | 44484 | 3.5% | 2.1%(+1.37)#134 | 3.4%(+0.141)#7,532 |
| 2. | 44483 | 3.4% | 2.1%(+1.24)#146 | 3.4%(+0.013)#7,868 |
| 3. | 44485 | 1.8% | 2.1%(-0.385)#407 | 3.4%(-1.61)#15,167 |
| 4. | 44481 | 0.29% | 2.1%(-1.86)#853 | 3.4%(-3.09)#24,936 |
1
Common Questions
What are the Top 3 Zip Codes with the Highest Percentage of Federal Government Employees in Warren, OH?
Top 3 Zip Codes with the Highest Percentage of Federal Government Employees in Warren, OH are:
What zip code has the Highest Percentage of Federal Government Employees in Warren, OH?
44484 has the Highest Percentage of Federal Government Employees in Warren, OH with 3.5%.
What is the Percentage of Federal Government Employees in Warren, OH?
Percentage of Federal Government Employees in Warren is 2.4%.
What is the Percentage of Federal Government Employees in Ohio?
Percentage of Federal Government Employees in Ohio is 2.1%.
What is the Percentage of Federal Government Employees in the United States?
Percentage of Federal Government Employees in the United States is 3.4%.