Zip Codes with the Highest Percentage of Population Employed in Health Diagnosing & Treating in Princeton, NJ
RELATED REPORTS & OPTIONS
Health Diagnosing & Treating
Princeton
Compare Zip Codes
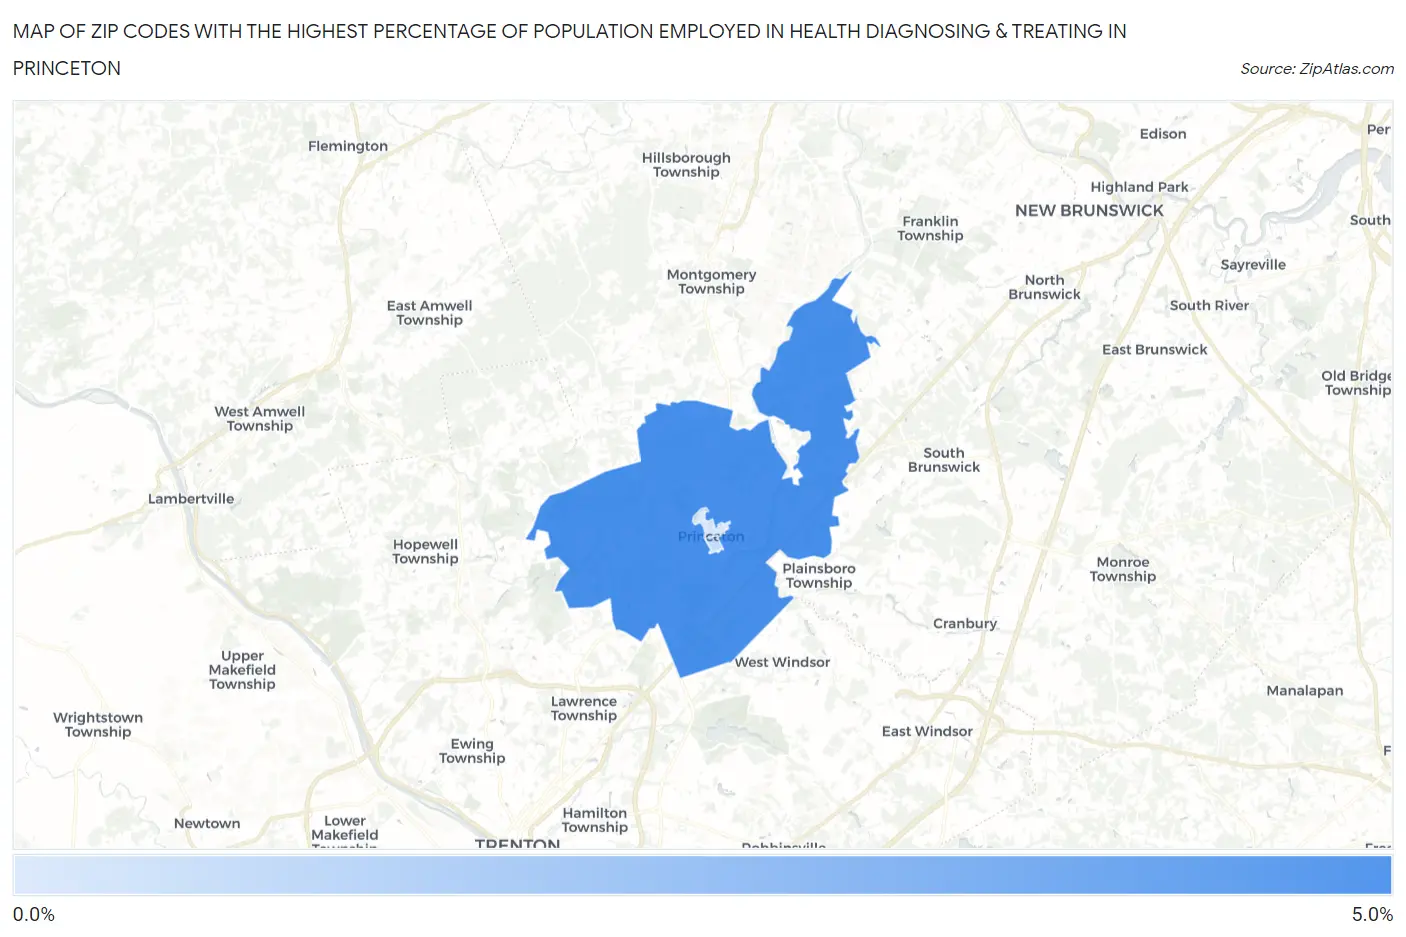
Map of Zip Codes with the Highest Percentage of Population Employed in Health Diagnosing & Treating in Princeton
0.66%
5.0%
Zip Codes with the Highest Percentage of Population Employed in Health Diagnosing & Treating in Princeton, NJ
| Zip Code | % Employed | vs State | vs National | |
| 1. | 08540 | 5.0% | 6.2%(-1.25)#398 | 6.2%(-1.26)#17,765 |
| 2. | 08544 | 1.4% | 6.2%(-4.87)#552 | 6.2%(-4.88)#27,369 |
| 3. | 08542 | 0.66% | 6.2%(-5.59)#554 | 6.2%(-5.59)#28,186 |
1
Common Questions
What are the Top Zip Codes with the Highest Percentage of Population Employed in Health Diagnosing & Treating in Princeton, NJ?
Top Zip Codes with the Highest Percentage of Population Employed in Health Diagnosing & Treating in Princeton, NJ are:
What zip code has the Highest Percentage of Population Employed in Health Diagnosing & Treating in Princeton, NJ?
08540 has the Highest Percentage of Population Employed in Health Diagnosing & Treating in Princeton, NJ with 5.0%.
What is the Percentage of Population Employed in Health Diagnosing & Treating in Princeton, NJ?
Percentage of Population Employed in Health Diagnosing & Treating in Princeton is 4.6%.
What is the Percentage of Population Employed in Health Diagnosing & Treating in New Jersey?
Percentage of Population Employed in Health Diagnosing & Treating in New Jersey is 6.2%.
What is the Percentage of Population Employed in Health Diagnosing & Treating in the United States?
Percentage of Population Employed in Health Diagnosing & Treating in the United States is 6.2%.