Zip Codes with the Highest Percentage of Population Employed in Arts, Entertainment & Recreation in Princeton, NJ
RELATED REPORTS & OPTIONS
Arts, Entertainment & Recreation
Princeton
Compare Zip Codes
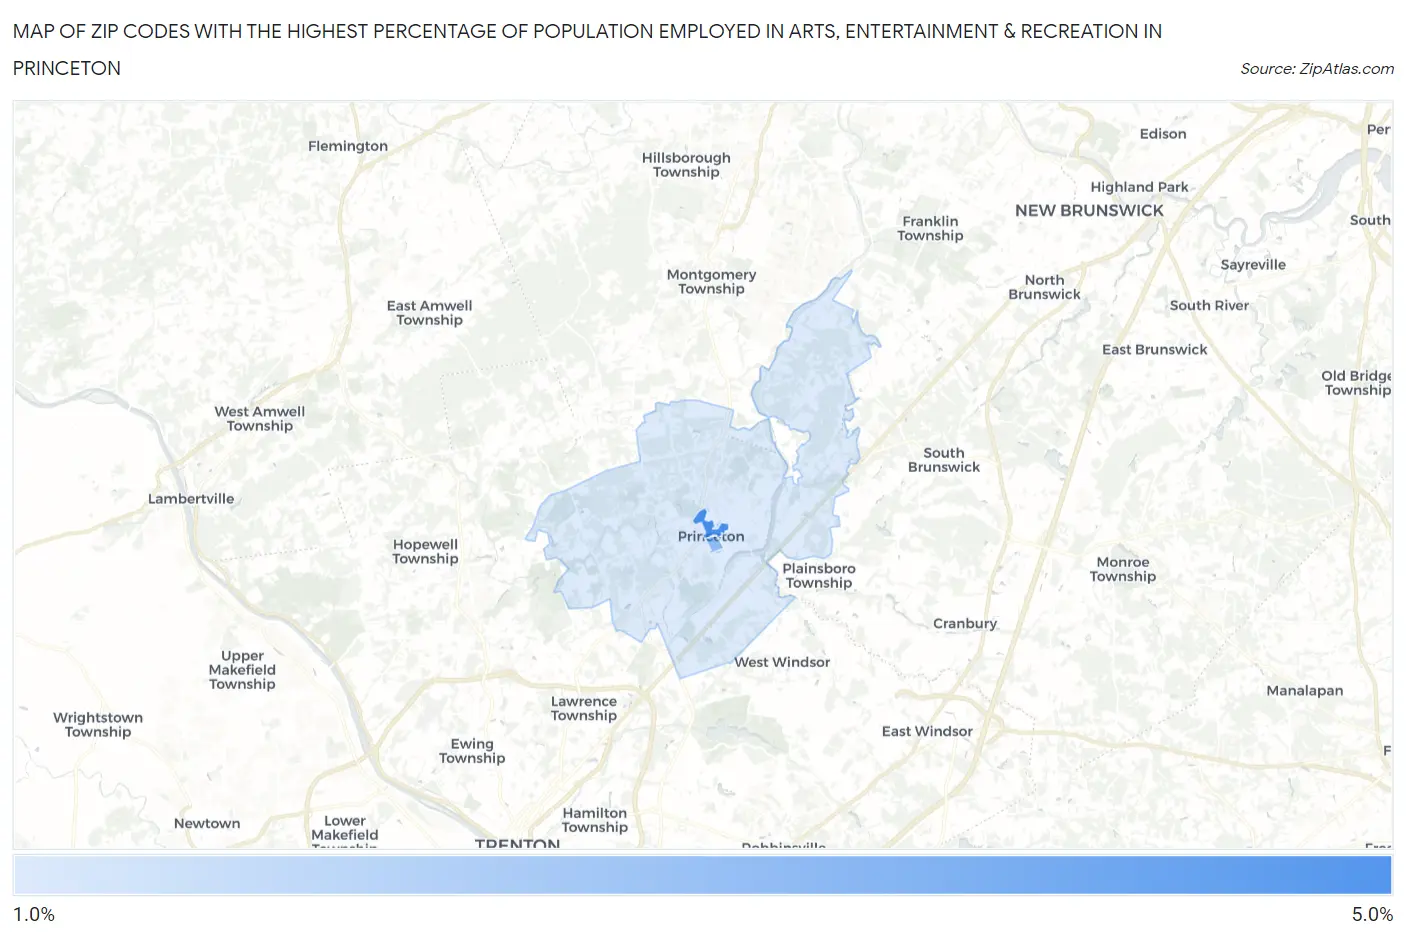
Map of Zip Codes with the Highest Percentage of Population Employed in Arts, Entertainment & Recreation in Princeton
1.1%
4.7%
Zip Codes with the Highest Percentage of Population Employed in Arts, Entertainment & Recreation in Princeton, NJ
| Zip Code | % Employed | vs State | vs National | |
| 1. | 08542 | 4.7% | 2.1%(+2.63)#46 | 2.1%(+2.62)#2,529 |
| 2. | 08544 | 3.0% | 2.1%(+0.887)#116 | 2.1%(+0.875)#5,486 |
| 3. | 08540 | 1.1% | 2.1%(-0.943)#425 | 2.1%(-0.955)#16,025 |
1
Common Questions
What are the Top Zip Codes with the Highest Percentage of Population Employed in Arts, Entertainment & Recreation in Princeton, NJ?
Top Zip Codes with the Highest Percentage of Population Employed in Arts, Entertainment & Recreation in Princeton, NJ are:
What zip code has the Highest Percentage of Population Employed in Arts, Entertainment & Recreation in Princeton, NJ?
08542 has the Highest Percentage of Population Employed in Arts, Entertainment & Recreation in Princeton, NJ with 4.7%.
What is the Percentage of Population Employed in Arts, Entertainment & Recreation in Princeton, NJ?
Percentage of Population Employed in Arts, Entertainment & Recreation in Princeton is 2.5%.
What is the Percentage of Population Employed in Arts, Entertainment & Recreation in New Jersey?
Percentage of Population Employed in Arts, Entertainment & Recreation in New Jersey is 2.1%.
What is the Percentage of Population Employed in Arts, Entertainment & Recreation in the United States?
Percentage of Population Employed in Arts, Entertainment & Recreation in the United States is 2.1%.