Zip Codes with the Highest Percentage of Scotch-Irish Population in Maine
RELATED REPORTS & OPTIONS
Scotch-Irish
Maine
Compare Zip Codes
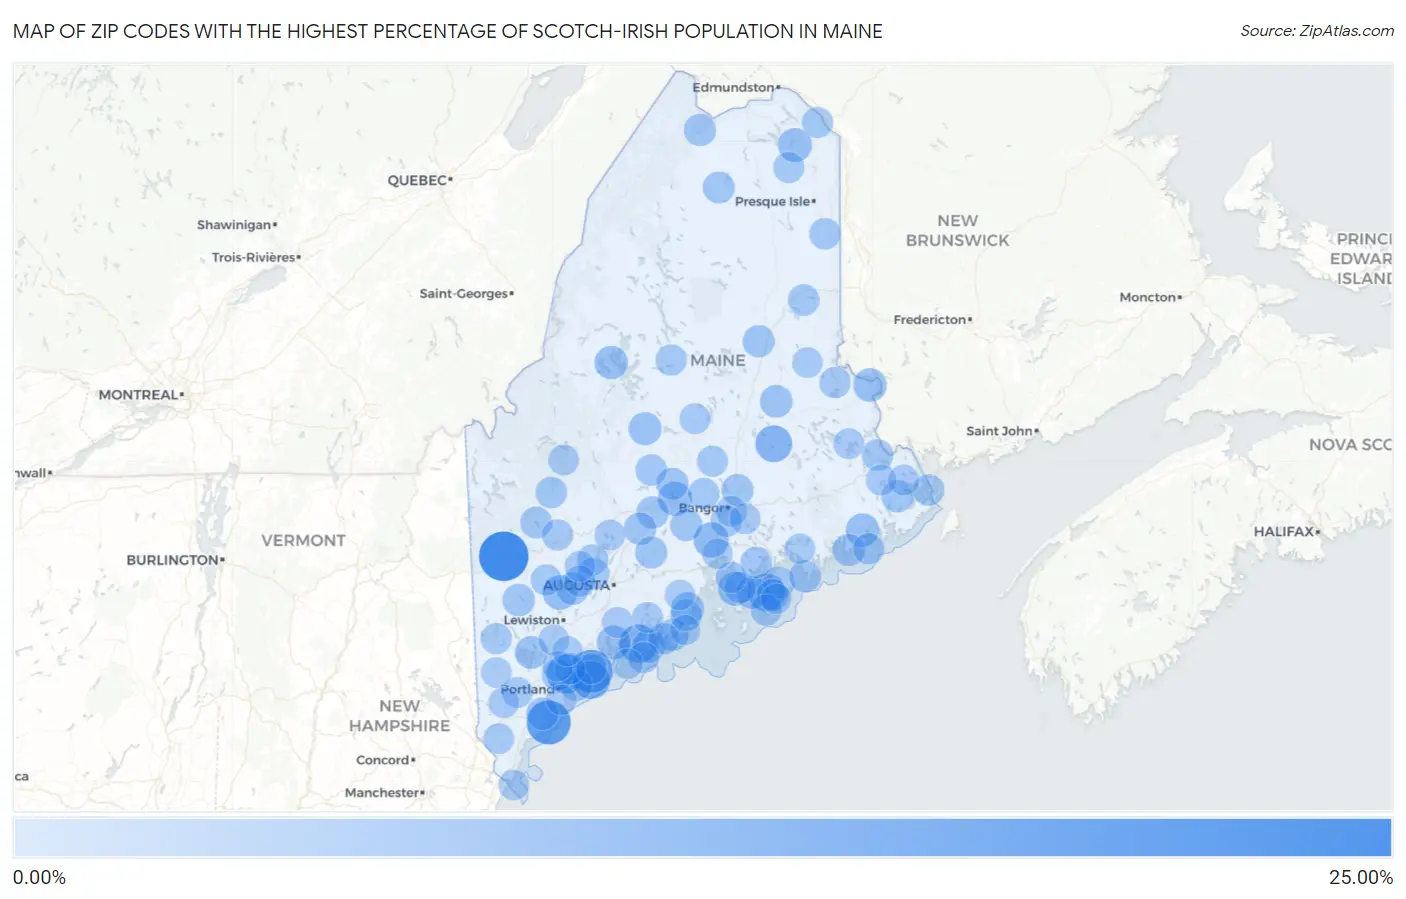
Map of Zip Codes with the Highest Percentage of Scotch-Irish Population in Maine
0.00%
25.00%
Zip Codes with the Highest Percentage of Scotch-Irish Population in Maine
| Zip Code | Scotch-Irish | vs State | vs National | |
| 1. | 04237 | 21.79% | 1.43%(+20.4)#1 | 0.82%(+21.0)#50 |
| 2. | 04006 | 16.00% | 1.43%(+14.6)#2 | 0.82%(+15.2)#93 |
| 3. | 04066 | 14.91% | 1.43%(+13.5)#3 | 0.82%(+14.1)#105 |
| 4. | 04110 | 10.99% | 1.43%(+9.56)#4 | 0.82%(+10.2)#180 |
| 5. | 04573 | 10.43% | 1.43%(+9.00)#5 | 0.82%(+9.62)#199 |
| 6. | 04003 | 9.76% | 1.43%(+8.32)#6 | 0.82%(+8.94)#236 |
| 7. | 04674 | 9.58% | 1.43%(+8.15)#7 | 0.82%(+8.77)#241 |
| 8. | 04417 | 8.60% | 1.43%(+7.17)#8 | 0.82%(+7.78)#294 |
| 9. | 04438 | 7.03% | 1.43%(+5.60)#9 | 0.82%(+6.21)#433 |
| 10. | 04282 | 6.18% | 1.43%(+4.75)#10 | 0.82%(+5.37)#527 |
| 11. | 04953 | 6.08% | 1.43%(+4.64)#11 | 0.82%(+5.26)#543 |
| 12. | 04579 | 5.78% | 1.43%(+4.35)#12 | 0.82%(+4.97)#592 |
| 13. | 04650 | 5.71% | 1.43%(+4.28)#13 | 0.82%(+4.90)#605 |
| 14. | 04783 | 5.68% | 1.43%(+4.24)#14 | 0.82%(+4.86)#612 |
| 15. | 04491 | 5.19% | 1.43%(+3.76)#15 | 0.82%(+4.38)#713 |
| 16. | 04478 | 5.13% | 1.43%(+3.69)#16 | 0.82%(+4.31)#729 |
| 17. | 04648 | 5.06% | 1.43%(+3.63)#17 | 0.82%(+4.24)#748 |
| 18. | 04564 | 5.05% | 1.43%(+3.61)#18 | 0.82%(+4.23)#751 |
| 19. | 04856 | 4.92% | 1.43%(+3.49)#19 | 0.82%(+4.11)#789 |
| 20. | 04464 | 4.67% | 1.43%(+3.23)#20 | 0.82%(+3.85)#857 |
| 21. | 04616 | 4.56% | 1.43%(+3.13)#21 | 0.82%(+3.75)#893 |
| 22. | 04071 | 4.50% | 1.43%(+3.06)#22 | 0.82%(+3.68)#916 |
| 23. | 04495 | 4.30% | 1.43%(+2.86)#23 | 0.82%(+3.48)#1,004 |
| 24. | 04063 | 4.21% | 1.43%(+2.78)#24 | 0.82%(+3.40)#1,036 |
| 25. | 04606 | 4.19% | 1.43%(+2.76)#25 | 0.82%(+3.38)#1,046 |
| 26. | 04628 | 4.19% | 1.43%(+2.76)#26 | 0.82%(+3.37)#1,047 |
| 27. | 04263 | 4.19% | 1.43%(+2.76)#27 | 0.82%(+3.37)#1,048 |
| 28. | 04967 | 4.13% | 1.43%(+2.70)#28 | 0.82%(+3.31)#1,075 |
| 29. | 04268 | 4.13% | 1.43%(+2.69)#29 | 0.82%(+3.31)#1,076 |
| 30. | 04927 | 4.08% | 1.43%(+2.65)#30 | 0.82%(+3.26)#1,089 |
| 31. | 04777 | 3.98% | 1.43%(+2.55)#31 | 0.82%(+3.16)#1,135 |
| 32. | 04910 | 3.98% | 1.43%(+2.55)#32 | 0.82%(+3.16)#1,136 |
| 33. | 04774 | 3.94% | 1.43%(+2.51)#33 | 0.82%(+3.12)#1,156 |
| 34. | 04563 | 3.89% | 1.43%(+2.46)#34 | 0.82%(+3.08)#1,182 |
| 35. | 04660 | 3.72% | 1.43%(+2.29)#35 | 0.82%(+2.90)#1,291 |
| 36. | 04932 | 3.71% | 1.43%(+2.28)#36 | 0.82%(+2.89)#1,299 |
| 37. | 04693 | 3.69% | 1.43%(+2.25)#37 | 0.82%(+2.87)#1,318 |
| 38. | 04612 | 3.67% | 1.43%(+2.24)#38 | 0.82%(+2.86)#1,328 |
| 39. | 04489 | 3.67% | 1.43%(+2.24)#39 | 0.82%(+2.85)#1,329 |
| 40. | 04019 | 3.64% | 1.43%(+2.20)#40 | 0.82%(+2.82)#1,347 |
| 41. | 04928 | 3.58% | 1.43%(+2.15)#41 | 0.82%(+2.77)#1,387 |
| 42. | 04768 | 3.53% | 1.43%(+2.09)#42 | 0.82%(+2.71)#1,418 |
| 43. | 04285 | 3.52% | 1.43%(+2.08)#43 | 0.82%(+2.70)#1,427 |
| 44. | 04355 | 3.44% | 1.43%(+2.01)#44 | 0.82%(+2.62)#1,483 |
| 45. | 04841 | 3.42% | 1.43%(+1.99)#45 | 0.82%(+2.60)#1,500 |
| 46. | 04684 | 3.36% | 1.43%(+1.93)#46 | 0.82%(+2.54)#1,566 |
| 47. | 04763 | 3.35% | 1.43%(+1.92)#47 | 0.82%(+2.54)#1,573 |
| 48. | 04983 | 3.26% | 1.43%(+1.83)#48 | 0.82%(+2.44)#1,654 |
| 49. | 04923 | 3.26% | 1.43%(+1.82)#49 | 0.82%(+2.44)#1,661 |
| 50. | 04673 | 3.23% | 1.43%(+1.79)#50 | 0.82%(+2.41)#1,700 |
| 51. | 04694 | 3.19% | 1.43%(+1.76)#51 | 0.82%(+2.37)#1,740 |
| 52. | 04456 | 3.17% | 1.43%(+1.74)#52 | 0.82%(+2.35)#1,758 |
| 53. | 04547 | 3.14% | 1.43%(+1.71)#53 | 0.82%(+2.33)#1,792 |
| 54. | 04631 | 3.14% | 1.43%(+1.70)#54 | 0.82%(+2.32)#1,799 |
| 55. | 04105 | 3.14% | 1.43%(+1.70)#55 | 0.82%(+2.32)#1,801 |
| 56. | 04734 | 3.12% | 1.43%(+1.69)#56 | 0.82%(+2.31)#1,811 |
| 57. | 04685 | 3.12% | 1.43%(+1.68)#57 | 0.82%(+2.30)#1,823 |
| 58. | 04474 | 3.01% | 1.43%(+1.58)#58 | 0.82%(+2.19)#1,945 |
| 59. | 04294 | 2.99% | 1.43%(+1.55)#59 | 0.82%(+2.17)#1,975 |
| 60. | 04352 | 2.97% | 1.43%(+1.53)#60 | 0.82%(+2.15)#1,987 |
| 61. | 04413 | 2.94% | 1.43%(+1.51)#61 | 0.82%(+2.12)#2,026 |
| 62. | 04284 | 2.90% | 1.43%(+1.47)#62 | 0.82%(+2.08)#2,078 |
| 63. | 04441 | 2.90% | 1.43%(+1.46)#63 | 0.82%(+2.08)#2,083 |
| 64. | 04785 | 2.86% | 1.43%(+1.43)#64 | 0.82%(+2.04)#2,130 |
| 65. | 04022 | 2.83% | 1.43%(+1.40)#65 | 0.82%(+2.01)#2,164 |
| 66. | 04554 | 2.81% | 1.43%(+1.38)#66 | 0.82%(+1.99)#2,195 |
| 67. | 04617 | 2.76% | 1.43%(+1.33)#67 | 0.82%(+1.94)#2,258 |
| 68. | 04410 | 2.75% | 1.43%(+1.32)#68 | 0.82%(+1.93)#2,263 |
| 69. | 04766 | 2.75% | 1.43%(+1.32)#69 | 0.82%(+1.93)#2,265 |
| 70. | 04649 | 2.74% | 1.43%(+1.30)#70 | 0.82%(+1.92)#2,279 |
| 71. | 04096 | 2.72% | 1.43%(+1.28)#71 | 0.82%(+1.90)#2,310 |
| 72. | 04555 | 2.70% | 1.43%(+1.27)#72 | 0.82%(+1.88)#2,326 |
| 73. | 04220 | 2.70% | 1.43%(+1.27)#73 | 0.82%(+1.88)#2,337 |
| 74. | 04666 | 2.64% | 1.43%(+1.21)#74 | 0.82%(+1.83)#2,413 |
| 75. | 04412 | 2.61% | 1.43%(+1.17)#75 | 0.82%(+1.79)#2,482 |
| 76. | 04342 | 2.59% | 1.43%(+1.16)#76 | 0.82%(+1.77)#2,512 |
| 77. | 04079 | 2.59% | 1.43%(+1.15)#77 | 0.82%(+1.77)#2,517 |
| 78. | 04415 | 2.58% | 1.43%(+1.15)#78 | 0.82%(+1.77)#2,525 |
| 79. | 04429 | 2.58% | 1.43%(+1.15)#79 | 0.82%(+1.76)#2,530 |
| 80. | 04978 | 2.55% | 1.43%(+1.11)#80 | 0.82%(+1.73)#2,597 |
| 81. | 04668 | 2.53% | 1.43%(+1.09)#81 | 0.82%(+1.71)#2,626 |
| 82. | 03906 | 2.50% | 1.43%(+1.07)#82 | 0.82%(+1.68)#2,673 |
| 83. | 04042 | 2.50% | 1.43%(+1.06)#83 | 0.82%(+1.68)#2,675 |
| 84. | 04657 | 2.48% | 1.43%(+1.05)#84 | 0.82%(+1.67)#2,701 |
| 85. | 04961 | 2.46% | 1.43%(+1.03)#85 | 0.82%(+1.64)#2,741 |
| 86. | 04349 | 2.46% | 1.43%(+1.02)#86 | 0.82%(+1.64)#2,744 |
| 87. | 04576 | 2.36% | 1.43%(+0.922)#87 | 0.82%(+1.54)#2,920 |
| 88. | 04260 | 2.35% | 1.43%(+0.915)#88 | 0.82%(+1.53)#2,932 |
| 89. | 04497 | 2.32% | 1.43%(+0.886)#89 | 0.82%(+1.50)#3,001 |
| 90. | 03905 | 2.31% | 1.43%(+0.878)#90 | 0.82%(+1.49)#3,014 |
| 91. | 04087 | 2.31% | 1.43%(+0.877)#91 | 0.82%(+1.49)#3,017 |
| 92. | 04021 | 2.25% | 1.43%(+0.813)#92 | 0.82%(+1.43)#3,157 |
| 93. | 04020 | 2.23% | 1.43%(+0.800)#93 | 0.82%(+1.41)#3,186 |
| 94. | 04858 | 2.19% | 1.43%(+0.755)#94 | 0.82%(+1.37)#3,299 |
| 95. | 04847 | 2.17% | 1.43%(+0.739)#95 | 0.82%(+1.35)#3,345 |
| 96. | 04107 | 2.15% | 1.43%(+0.720)#96 | 0.82%(+1.34)#3,381 |
| 97. | 04653 | 2.14% | 1.43%(+0.710)#97 | 0.82%(+1.32)#3,409 |
| 98. | 04069 | 2.13% | 1.43%(+0.692)#98 | 0.82%(+1.31)#3,451 |
| 99. | 04664 | 2.11% | 1.43%(+0.679)#99 | 0.82%(+1.29)#3,487 |
| 100. | 04981 | 2.10% | 1.43%(+0.664)#100 | 0.82%(+1.28)#3,533 |
Common Questions
What are the Top 10 Zip Codes with the Highest Percentage of Scotch-Irish Population in Maine?
Top 10 Zip Codes with the Highest Percentage of Scotch-Irish Population in Maine are:
What zip code has the Highest Percentage of Scotch-Irish Population in Maine?
04237 has the Highest Percentage of Scotch-Irish Population in Maine with 21.79%.
What is the Percentage of Scotch-Irish Population in the State of Maine?
Percentage of Scotch-Irish Population in Maine is 1.43%.
What is the Percentage of Scotch-Irish Population in the United States?
Percentage of Scotch-Irish Population in the United States is 0.82%.