Zip Codes with the Highest Percentage of Households Without a Vehicle in Lexington, KY

RELATED REPORTS & OPTIONS

Households without a Cars
Population
Families and Households
Female Fertility
Female Fertility (Unmarried)
Race (Community Size)
Race (Percentage)
Ancestry (Community Size)
AfghanAfricanAlbanianAmericanApacheArabArgentineanArmenianAustralianAustrianBasqueBelgianBelizeanBhutaneseBlackfeetBrazilianBritishBulgarianBurmeseCajunCambodianCanadianCape VerdeanCentral AmericanCentral American IndianCherokeeChickasawChileanChoctawColombianCroatianCubanCzechCzechoslovakianDanishDominicanDutchEastern EuropeanEcuadorianEgyptianEnglishEthiopianEuropeanFilipinoFinnishFrenchFrench CanadianGermanGerman RussianGhanaianGreekGuatemalanGuyaneseHaitianHonduranHungarianIndian (Asian)IndonesianIranianIraqiIrishIroquoisIsraeliItalianJamaicanJapaneseJordanianKenyanKoreanLaotianLatvianLebaneseLithuanianLuxembourgerMacedonianMalaysianMexicanMexican American IndianMoroccanNative HawaiianNavajoNew ZealanderNicaraguanNigerianNorthern EuropeanNorwegianPakistaniPalestinianPanamanianPennsylvania GermanPeruvianPolishPortuguesePotawatomiPuerto RicanRomanianRussianSalvadoranSamoanScandinavianScotch-IrishScottishSenegaleseSerbianSierra LeoneanSiouxSlavicSlovakSloveneSouth AfricanSouth AmericanSouth American IndianSpaniardSpanishSri LankanSubsaharan AfricanSudaneseSwedishSwissSyrianThaiTrinidadian and TobagonianTurkishUkrainianVenezuelanVietnameseWelshWest IndianYugoslavian
Ancestry (Percentage)
AfghanAfricanAlbanianAmericanApacheArabArgentineanArmenianAustralianAustrianBasqueBelgianBelizeanBhutaneseBlackfeetBrazilianBritishBulgarianBurmeseCajunCambodianCanadianCape VerdeanCentral AmericanCentral American IndianCherokeeChickasawChileanChoctawColombianCroatianCubanCzechCzechoslovakianDanishDominicanDutchEastern EuropeanEcuadorianEgyptianEnglishEthiopianEuropeanFilipinoFinnishFrenchFrench CanadianGermanGerman RussianGhanaianGreekGuatemalanGuyaneseHaitianHonduranHungarianIndian (Asian)IndonesianIranianIraqiIrishIroquoisIsraeliItalianJamaicanJapaneseJordanianKenyanKoreanLaotianLatvianLebaneseLithuanianLuxembourgerMacedonianMalaysianMexicanMexican American IndianMoroccanNative HawaiianNavajoNew ZealanderNicaraguanNigerianNorthern EuropeanNorwegianPakistaniPalestinianPanamanianPennsylvania GermanPeruvianPolishPortuguesePotawatomiPuerto RicanRomanianRussianSalvadoranSamoanScandinavianScotch-IrishScottishSenegaleseSerbianSierra LeoneanSiouxSlavicSlovakSloveneSouth AfricanSouth AmericanSouth American IndianSpaniardSpanishSri LankanSubsaharan AfricanSudaneseSwedishSwissSyrianThaiTrinidadian and TobagonianTurkishUkrainianVenezuelanVietnameseWelshWest IndianYugoslavian
Immigrant Origin (Total)
AfghanistanAfricaArgentinaAsiaAustraliaAustriaBahamasBangladeshBelarusBosnia and HerzegovinaBrazilBulgariaBurma / MyanmarCambodiaCanadaCaribbeanCentral AmericaChileChinaColombiaCongoCroatiaCubaDominican RepublicEastern AfricaEastern AsiaEastern EuropeEcuadorEgyptEl SalvadorEnglandEthiopiaEuropeFranceGermanyGhanaGreeceGuatemalaHaitiHondurasHong KongHungaryIndiaIndonesiaIranIraqIrelandIsraelItalyJamaicaJapanJordanKazakhstanKenyaKoreaKuwaitLatin AmericaLebanonLiberiaMexicoMiddle AfricaMoroccoNepalNetherlandsNigeriaNorthern AfricaNorthern EuropeOceaniaPakistanPanamaPeruPhilippinesPolandRussiaSaudi ArabiaScotlandSenegalSingaporeSouth AfricaSouth AmericaSouth Central AsiaSouth Eastern AsiaSouthern EuropeSpainSri LankaSwedenSwitzerlandSyriaTaiwanThailandTrinidad and TobagoTurkeyUgandaUkraineVenezuelaVietnamWestern AfricaWestern AsiaWestern EuropeZaire
Immigrant Origin (Percentage)
AfghanistanAfricaArgentinaAsiaAustraliaAustriaBahamasBangladeshBelarusBosnia and HerzegovinaBrazilBulgariaBurma / MyanmarCambodiaCanadaCaribbeanCentral AmericaChileChinaColombiaCongoCroatiaCubaDominican RepublicEastern AfricaEastern AsiaEastern EuropeEcuadorEgyptEl SalvadorEnglandEthiopiaEuropeFranceGermanyGhanaGreeceGuatemalaHaitiHondurasHong KongHungaryIndiaIndonesiaIranIraqIrelandIsraelItalyJamaicaJapanJordanKazakhstanKenyaKoreaKuwaitLatin AmericaLebanonLiberiaMexicoMiddle AfricaMoroccoNepalNetherlandsNigeriaNorthern AfricaNorthern EuropeOceaniaPakistanPanamaPeruPhilippinesPolandRussiaSaudi ArabiaScotlandSenegalSingaporeSouth AfricaSouth AmericaSouth Central AsiaSouth Eastern AsiaSouthern EuropeSpainSri LankaSwedenSwitzerlandSyriaTaiwanThailandTrinidad and TobagoTurkeyUgandaUkraineVenezuelaVietnamWestern AfricaWestern AsiaWestern EuropeZaire
Income
Income (Families)
Income (Households)
Poverty
Poverty (Families)
Unemployment
Employment Occupations
Employment Industries
Employer Class
Commute Time
Commute Means
School Enrollment
Education by Degree Field
Occupancy
Finances
Physical Characteristics
Lexington
Compare Zip Codes
Comparison Subject

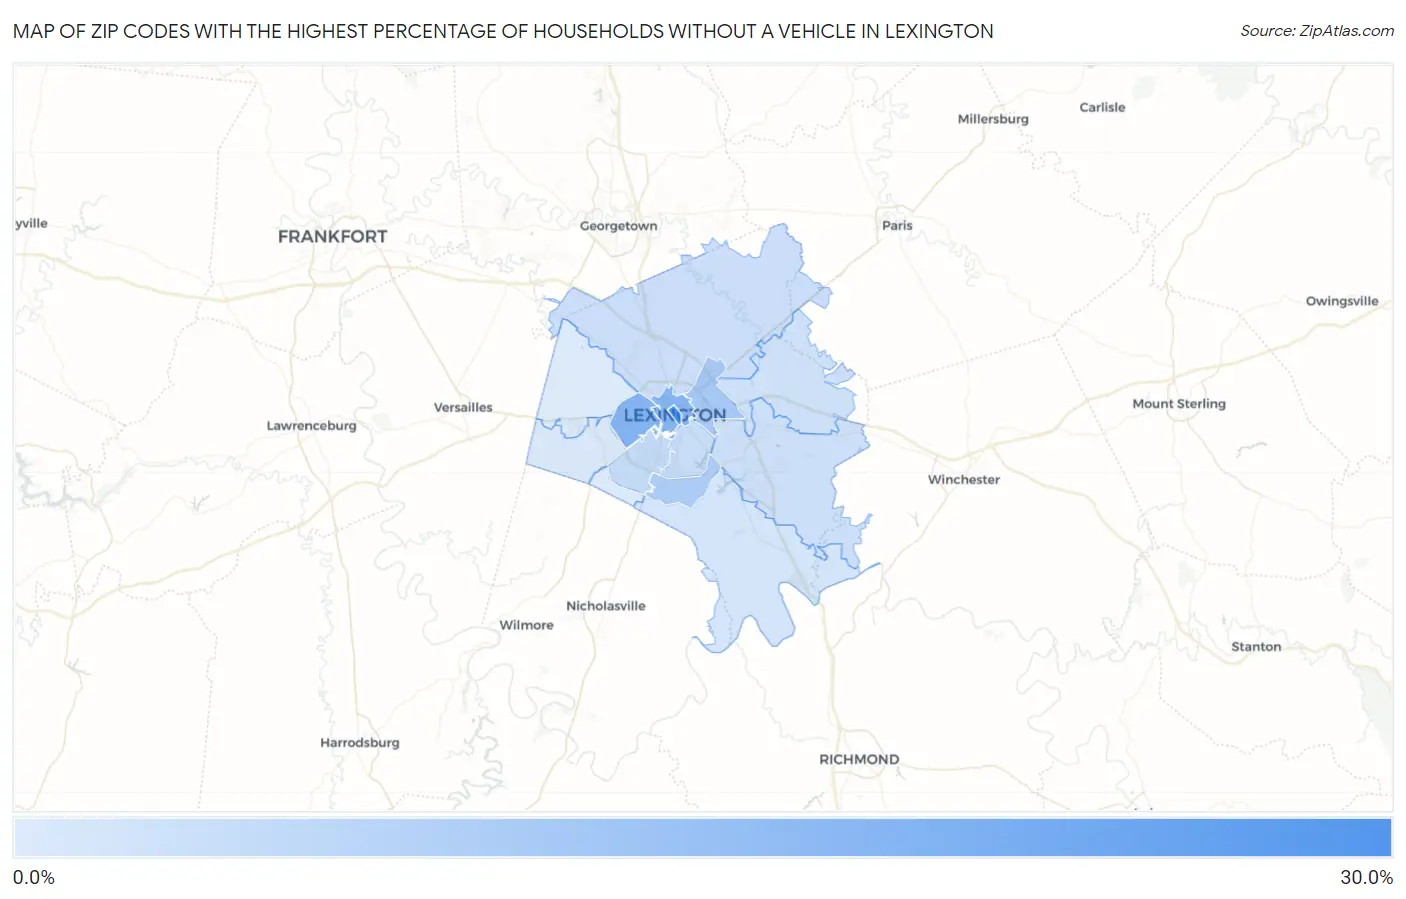
Map of Zip Codes with the Highest Percentage of Households Without a Vehicle in Lexington

0.0%
30.0%
Zip Codes with the Highest Percentage of Households Without a Vehicle in Lexington Map

Zip Codes with the Highest Percentage of Households Without a Vehicle in Lexington, KY

Zip Code Housholds Without a Car vs State vs National
1.4050729.0%6.7%(+22.3)#178.3%(+20.7)#847
2.4050816.7%6.7%(+10.00)#598.3%(+8.40)#2,009
3.4050416.6%6.7%(+9.90)#608.3%(+8.30)#2,037
4.4050510.3%6.7%(+3.60)#1398.3%(+2.00)#4,631
5.405179.3%6.7%(+2.60)#1708.3%(+1.00)#5,422
6.405035.0%6.7%(-1.70)#3538.3%(-3.30)#12,856
7.405024.4%6.7%(-2.30)#3838.3%(-3.90)#14,501
8.405114.0%6.7%(-2.70)#4158.3%(-4.30)#15,705
9.405093.8%6.7%(-2.90)#4248.3%(-4.50)#16,324
10.405163.3%6.7%(-3.40)#4588.3%(-5.00)#18,160
11.405152.6%6.7%(-4.10)#4978.3%(-5.70)#20,408
12.405131.8%6.7%(-4.90)#5398.3%(-6.50)#23,176
13.405141.0%6.7%(-5.70)#5798.3%(-7.30)#25,622
14.405100.90%6.7%(-5.80)#5848.3%(-7.40)#25,971

Common Questions

What are the Top 10 Zip Codes with the Highest Percentage of Households Without a Vehicle in Lexington, KY?
Top 10 Zip Codes with the Highest Percentage of Households Without a Vehicle in Lexington, KY are:
#1
29.0%
#2
16.7%
#3
16.6%
#4
10.3%
#5
9.3%
#6
5.0%
#7
4.4%
#8
4.0%
#9
3.8%
#10
3.3%
What zip code has the Highest Percentage of Households Without a Vehicle in Lexington, KY?
40507 has the Highest Percentage of Households Without a Vehicle in Lexington, KY with 29.0%.
What is the Percentage of Households Without a Vehicle in Lexington, KY?
Percentage of Households Without a Vehicle in Lexington is 7.2%.
What is the Percentage of Households Without a Vehicle in Kentucky?
Percentage of Households Without a Vehicle in Kentucky is 6.7%.
What is the Percentage of Households Without a Vehicle in the United States?
Percentage of Households Without a Vehicle in the United States is 8.3%.