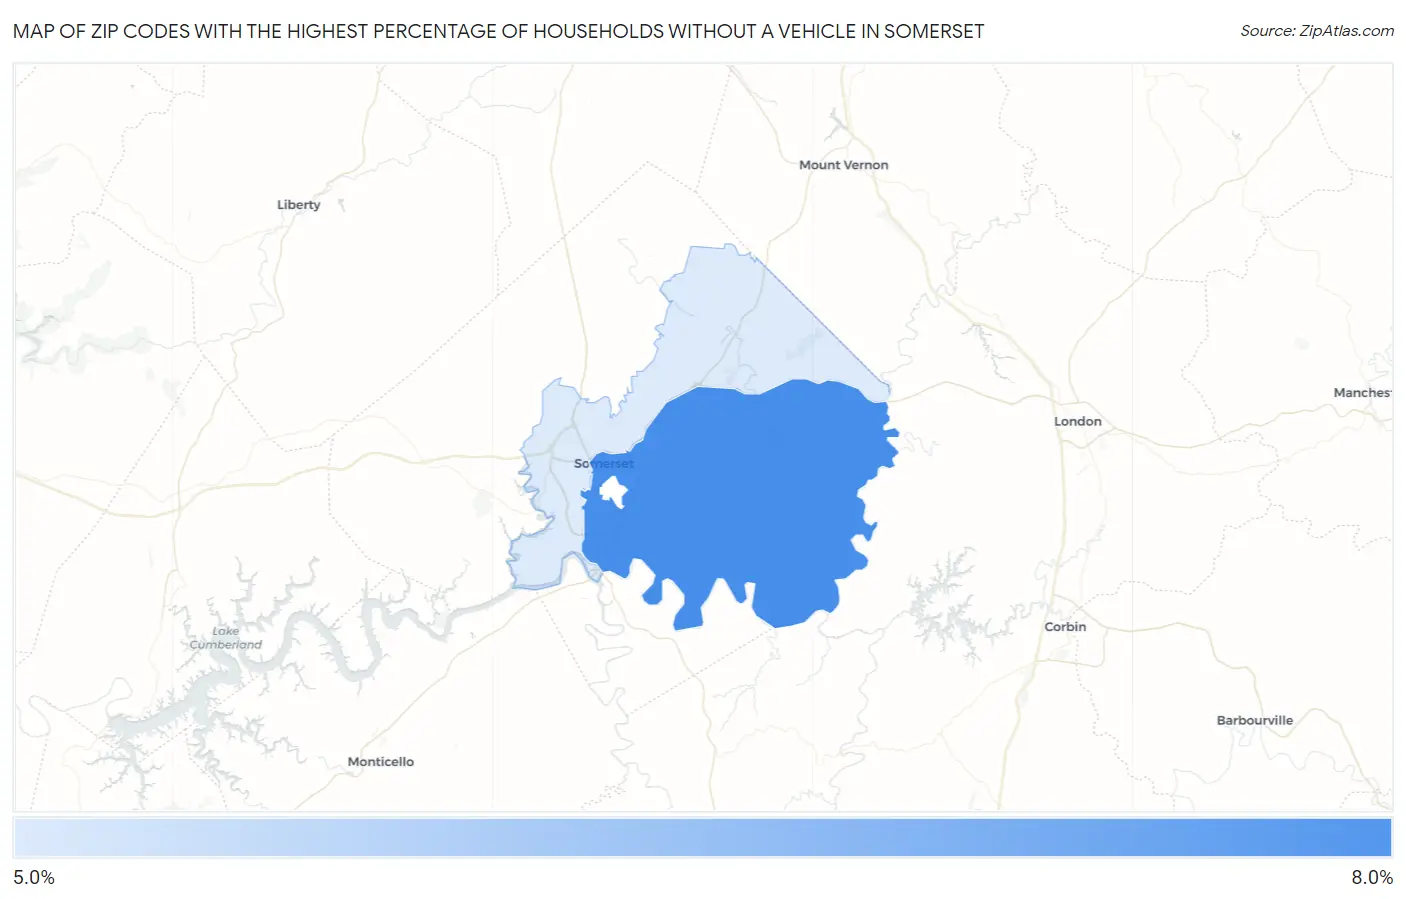
Zip Codes with the Highest Percentage of Households Without a Vehicle in Somerset, KY
RELATED REPORTS & OPTIONS
Households without a Cars
Somerset
Compare Zip Codes
Map of Zip Codes with the Highest Percentage of Households Without a Vehicle in Somerset
5.5%
6.3%
Zip Codes with the Highest Percentage of Households Without a Vehicle in Somerset, KY
| Zip Code | Housholds Without a Car | vs State | vs National | |
| 1. | 42501 | 6.3% | 6.7%(-0.400)#284 | 8.3%(-2.00)#9,822 |
| 2. | 42503 | 5.5% | 6.7%(-1.20)#323 | 8.3%(-2.80)#11,633 |
1
Common Questions
What are the Top Zip Codes with the Highest Percentage of Households Without a Vehicle in Somerset, KY?
Top Zip Codes with the Highest Percentage of Households Without a Vehicle in Somerset, KY are:
What zip code has the Highest Percentage of Households Without a Vehicle in Somerset, KY?
42501 has the Highest Percentage of Households Without a Vehicle in Somerset, KY with 6.3%.
What is the Percentage of Households Without a Vehicle in Somerset, KY?
Percentage of Households Without a Vehicle in Somerset is 9.0%.
What is the Percentage of Households Without a Vehicle in Kentucky?
Percentage of Households Without a Vehicle in Kentucky is 6.7%.
What is the Percentage of Households Without a Vehicle in the United States?
Percentage of Households Without a Vehicle in the United States is 8.3%.