Zip Codes with the Highest Percentage of Households Without a Vehicle in Paducah, KY
RELATED REPORTS & OPTIONS
Households without a Cars
Paducah
Compare Zip Codes
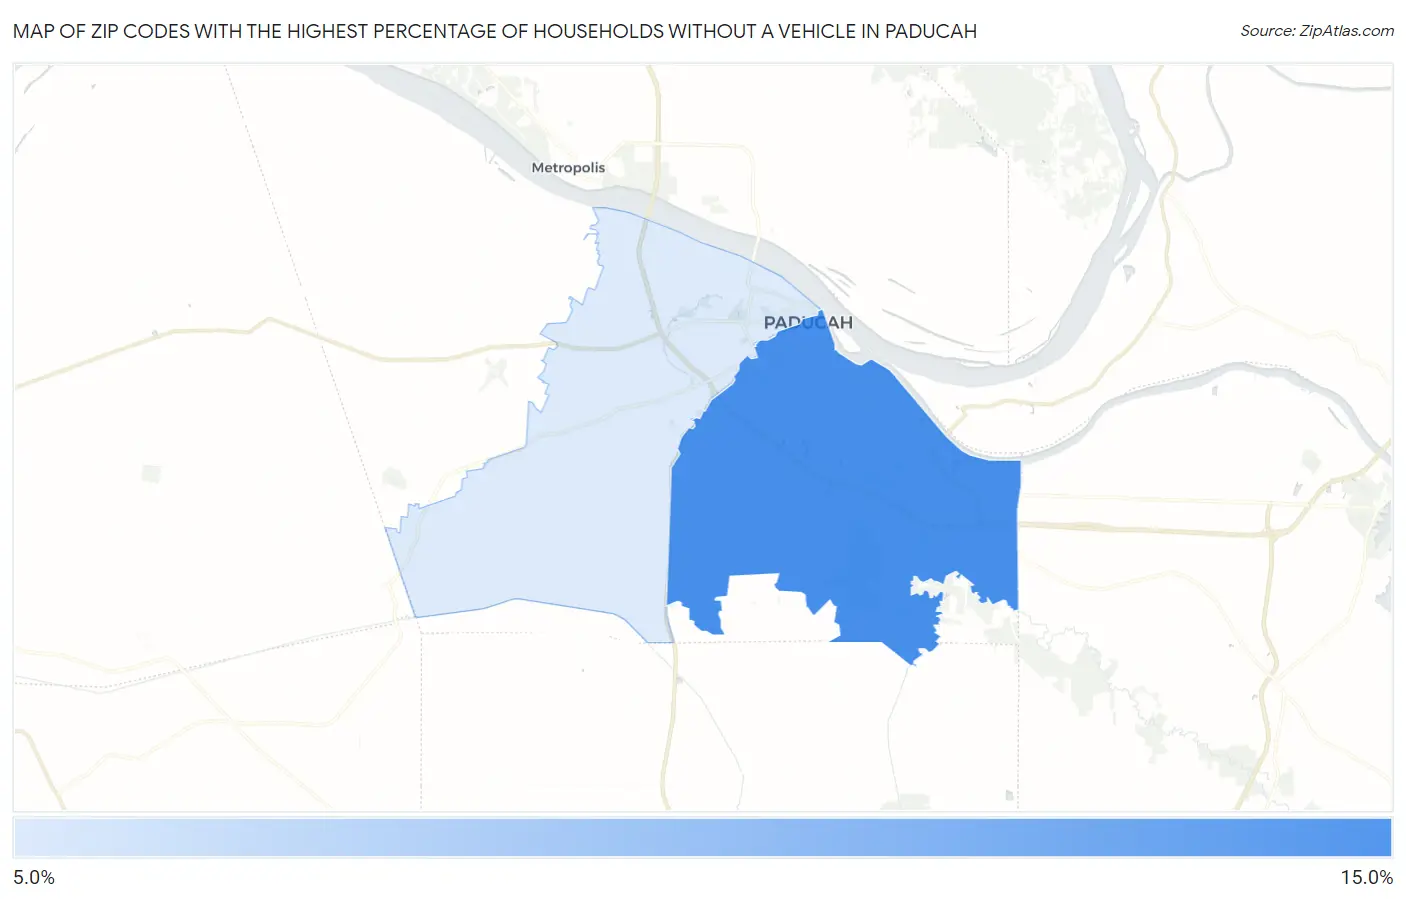
Map of Zip Codes with the Highest Percentage of Households Without a Vehicle in Paducah
8.0%
10.2%
Zip Codes with the Highest Percentage of Households Without a Vehicle in Paducah, KY
| Zip Code | Housholds Without a Car | vs State | vs National | |
| 1. | 42003 | 10.2% | 6.7%(+3.50)#144 | 8.3%(+1.90)#4,702 |
| 2. | 42001 | 8.0% | 6.7%(+1.30)#209 | 8.3%(-0.300)#6,915 |
1
Common Questions
What are the Top Zip Codes with the Highest Percentage of Households Without a Vehicle in Paducah, KY?
Top Zip Codes with the Highest Percentage of Households Without a Vehicle in Paducah, KY are:
What zip code has the Highest Percentage of Households Without a Vehicle in Paducah, KY?
42003 has the Highest Percentage of Households Without a Vehicle in Paducah, KY with 10.2%.
What is the Percentage of Households Without a Vehicle in Paducah, KY?
Percentage of Households Without a Vehicle in Paducah is 14.0%.
What is the Percentage of Households Without a Vehicle in Kentucky?
Percentage of Households Without a Vehicle in Kentucky is 6.7%.
What is the Percentage of Households Without a Vehicle in the United States?
Percentage of Households Without a Vehicle in the United States is 8.3%.