Zip Codes with the Highest Percentage of Households Without a Vehicle in Covington, KY
RELATED REPORTS & OPTIONS
Households without a Cars
Covington
Compare Zip Codes
Map of Zip Codes with the Highest Percentage of Households Without a Vehicle in Covington
12.6%
16.1%
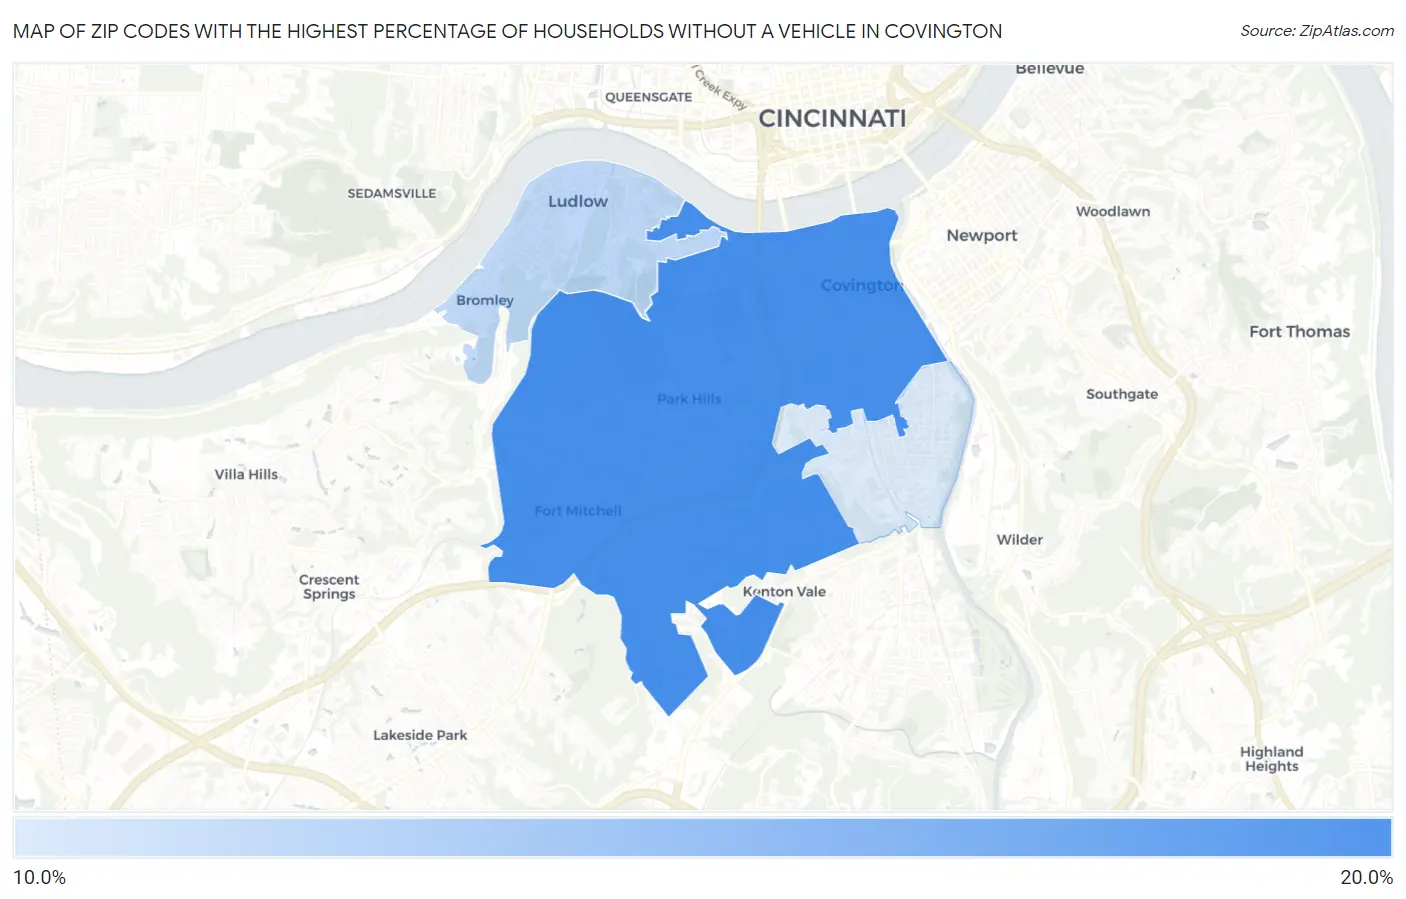
Zip Codes with the Highest Percentage of Households Without a Vehicle in Covington, KY
| Zip Code | Housholds Without a Car | vs State | vs National | |
| 1. | 41011 | 16.1% | 6.7%(+9.40)#62 | 8.3%(+7.80)#2,126 |
| 2. | 41016 | 13.3% | 6.7%(+6.60)#85 | 8.3%(+5.00)#2,982 |
| 3. | 41014 | 12.6% | 6.7%(+5.90)#98 | 8.3%(+4.30)#3,291 |
1
Common Questions
What are the Top Zip Codes with the Highest Percentage of Households Without a Vehicle in Covington, KY?
Top Zip Codes with the Highest Percentage of Households Without a Vehicle in Covington, KY are:
What zip code has the Highest Percentage of Households Without a Vehicle in Covington, KY?
41011 has the Highest Percentage of Households Without a Vehicle in Covington, KY with 16.1%.
What is the Percentage of Households Without a Vehicle in Covington, KY?
Percentage of Households Without a Vehicle in Covington is 16.4%.
What is the Percentage of Households Without a Vehicle in Kentucky?
Percentage of Households Without a Vehicle in Kentucky is 6.7%.
What is the Percentage of Households Without a Vehicle in the United States?
Percentage of Households Without a Vehicle in the United States is 8.3%.