Zip Codes with the Highest Percentage of Population Employed in Food Preparation & Serving in Olathe, KS
RELATED REPORTS & OPTIONS
Food Preparation & Serving
Olathe
Compare Zip Codes
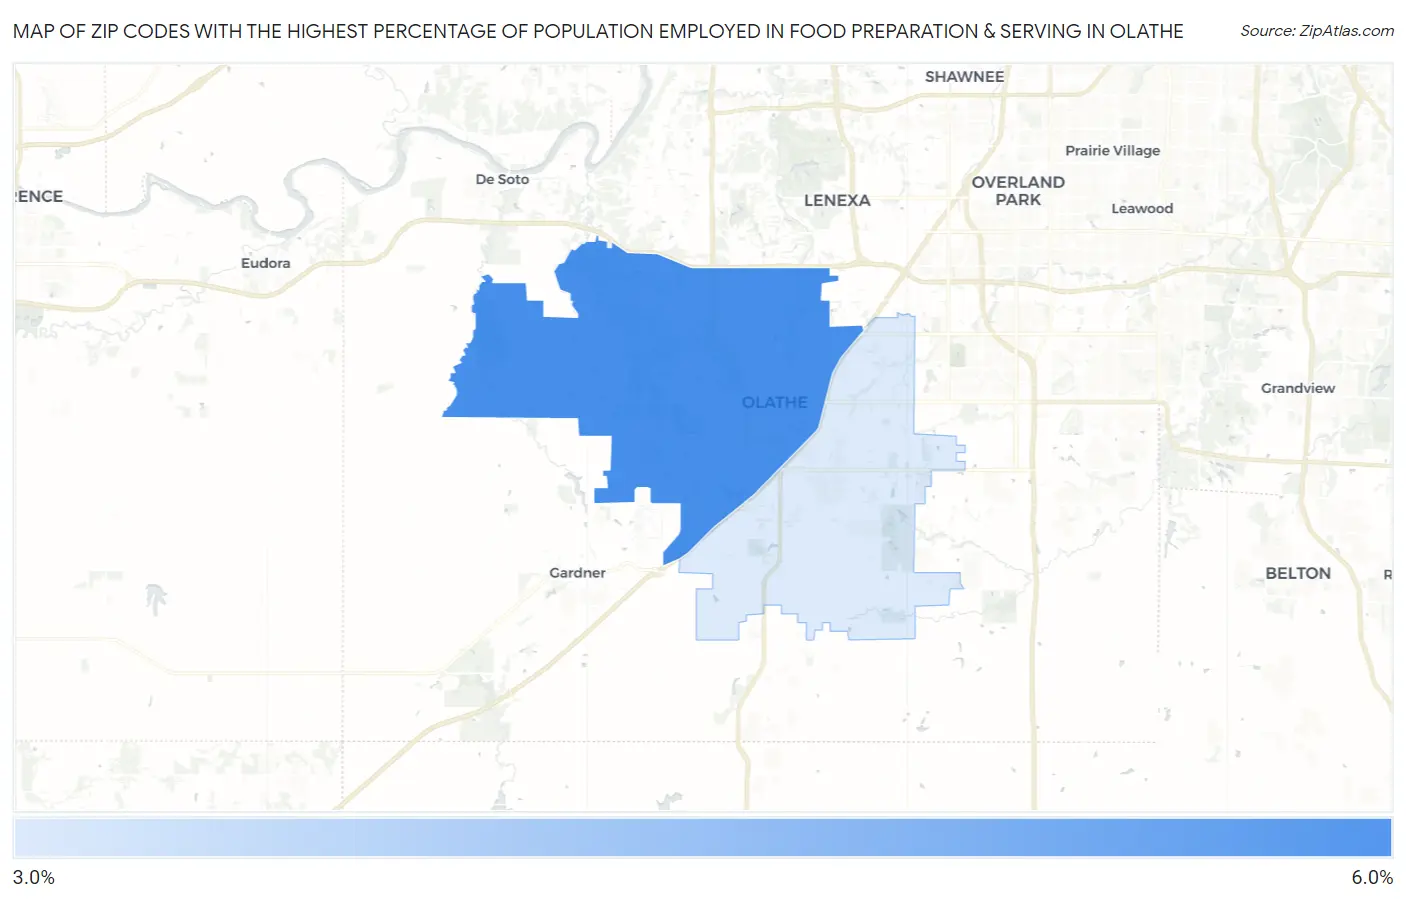
Map of Zip Codes with the Highest Percentage of Population Employed in Food Preparation & Serving in Olathe
3.7%
5.4%
Zip Codes with the Highest Percentage of Population Employed in Food Preparation & Serving in Olathe, KS
| Zip Code | % Employed | vs State | vs National | |
| 1. | 66061 | 5.4% | 5.2%(+0.156)#190 | 5.3%(+0.064)#11,579 |
| 2. | 66062 | 3.7% | 5.2%(-1.48)#324 | 5.3%(-1.57)#18,260 |
1
Common Questions
What are the Top Zip Codes with the Highest Percentage of Population Employed in Food Preparation & Serving in Olathe, KS?
Top Zip Codes with the Highest Percentage of Population Employed in Food Preparation & Serving in Olathe, KS are:
What zip code has the Highest Percentage of Population Employed in Food Preparation & Serving in Olathe, KS?
66061 has the Highest Percentage of Population Employed in Food Preparation & Serving in Olathe, KS with 5.4%.
What is the Percentage of Population Employed in Food Preparation & Serving in Olathe, KS?
Percentage of Population Employed in Food Preparation & Serving in Olathe is 4.5%.
What is the Percentage of Population Employed in Food Preparation & Serving in Kansas?
Percentage of Population Employed in Food Preparation & Serving in Kansas is 5.2%.
What is the Percentage of Population Employed in Food Preparation & Serving in the United States?
Percentage of Population Employed in Food Preparation & Serving in the United States is 5.3%.