Zip Codes with the Highest Percentage of Population Employed in Food Preparation & Serving in Mission, KS
RELATED REPORTS & OPTIONS
Food Preparation & Serving
Mission
Compare Zip Codes
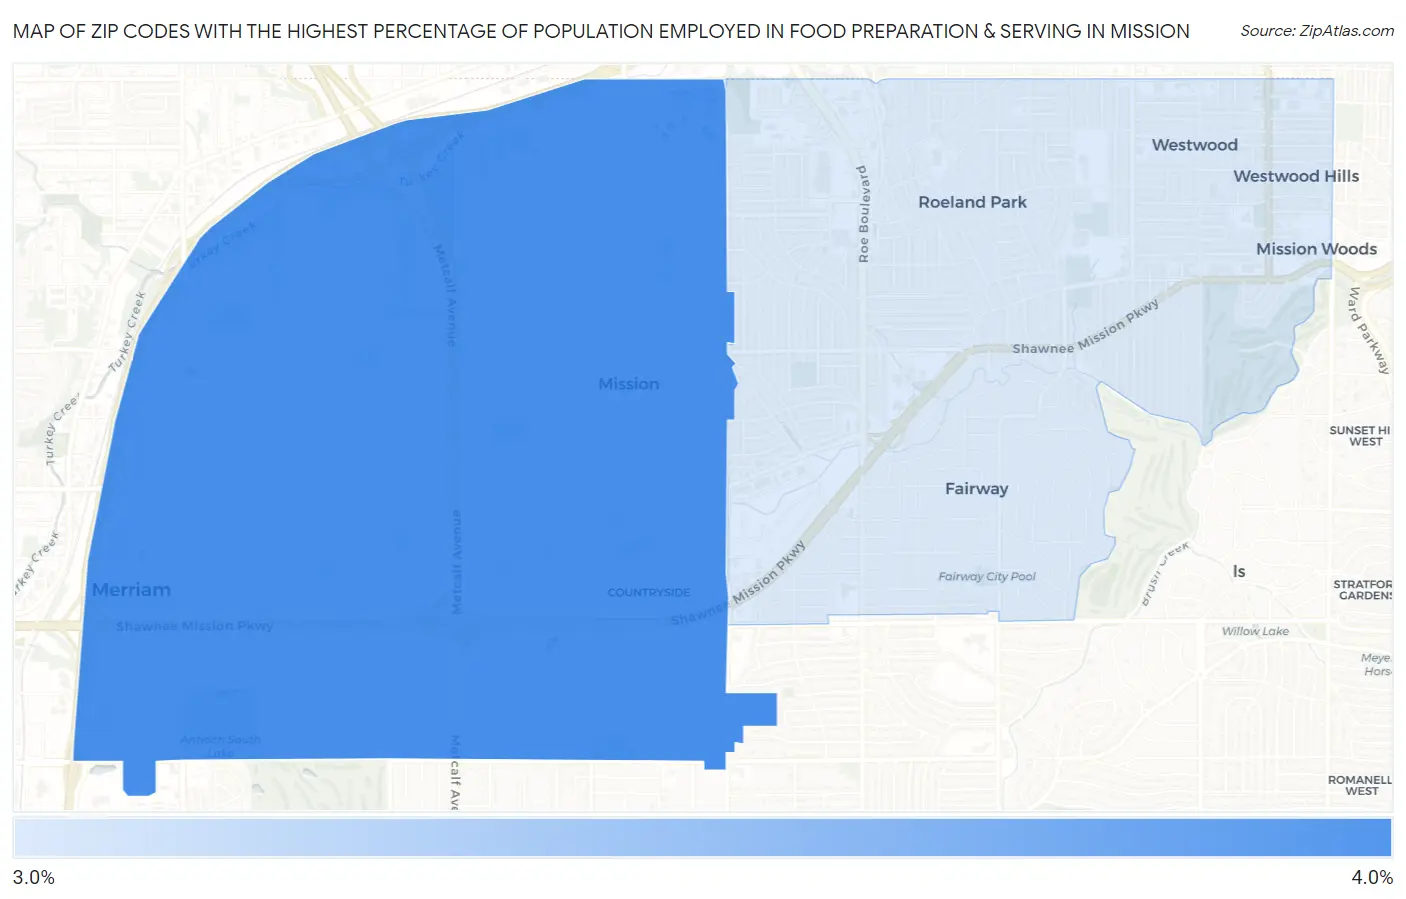
Map of Zip Codes with the Highest Percentage of Population Employed in Food Preparation & Serving in Mission
3.6%
3.9%
Zip Codes with the Highest Percentage of Population Employed in Food Preparation & Serving in Mission, KS
| Zip Code | % Employed | vs State | vs National | |
| 1. | 66202 | 3.9% | 5.2%(-1.34)#314 | 5.3%(-1.43)#17,736 |
| 2. | 66205 | 3.6% | 5.2%(-1.61)#335 | 5.3%(-1.71)#18,860 |
1
Common Questions
What are the Top Zip Codes with the Highest Percentage of Population Employed in Food Preparation & Serving in Mission, KS?
Top Zip Codes with the Highest Percentage of Population Employed in Food Preparation & Serving in Mission, KS are:
What zip code has the Highest Percentage of Population Employed in Food Preparation & Serving in Mission, KS?
66202 has the Highest Percentage of Population Employed in Food Preparation & Serving in Mission, KS with 3.9%.
What is the Percentage of Population Employed in Food Preparation & Serving in Mission, KS?
Percentage of Population Employed in Food Preparation & Serving in Mission is 2.0%.
What is the Percentage of Population Employed in Food Preparation & Serving in Kansas?
Percentage of Population Employed in Food Preparation & Serving in Kansas is 5.2%.
What is the Percentage of Population Employed in Food Preparation & Serving in the United States?
Percentage of Population Employed in Food Preparation & Serving in the United States is 5.3%.