Zip Codes with the Highest Percentage of Population Employed in Food Preparation & Serving in Manhattan, KS
RELATED REPORTS & OPTIONS
Food Preparation & Serving
Manhattan
Compare Zip Codes
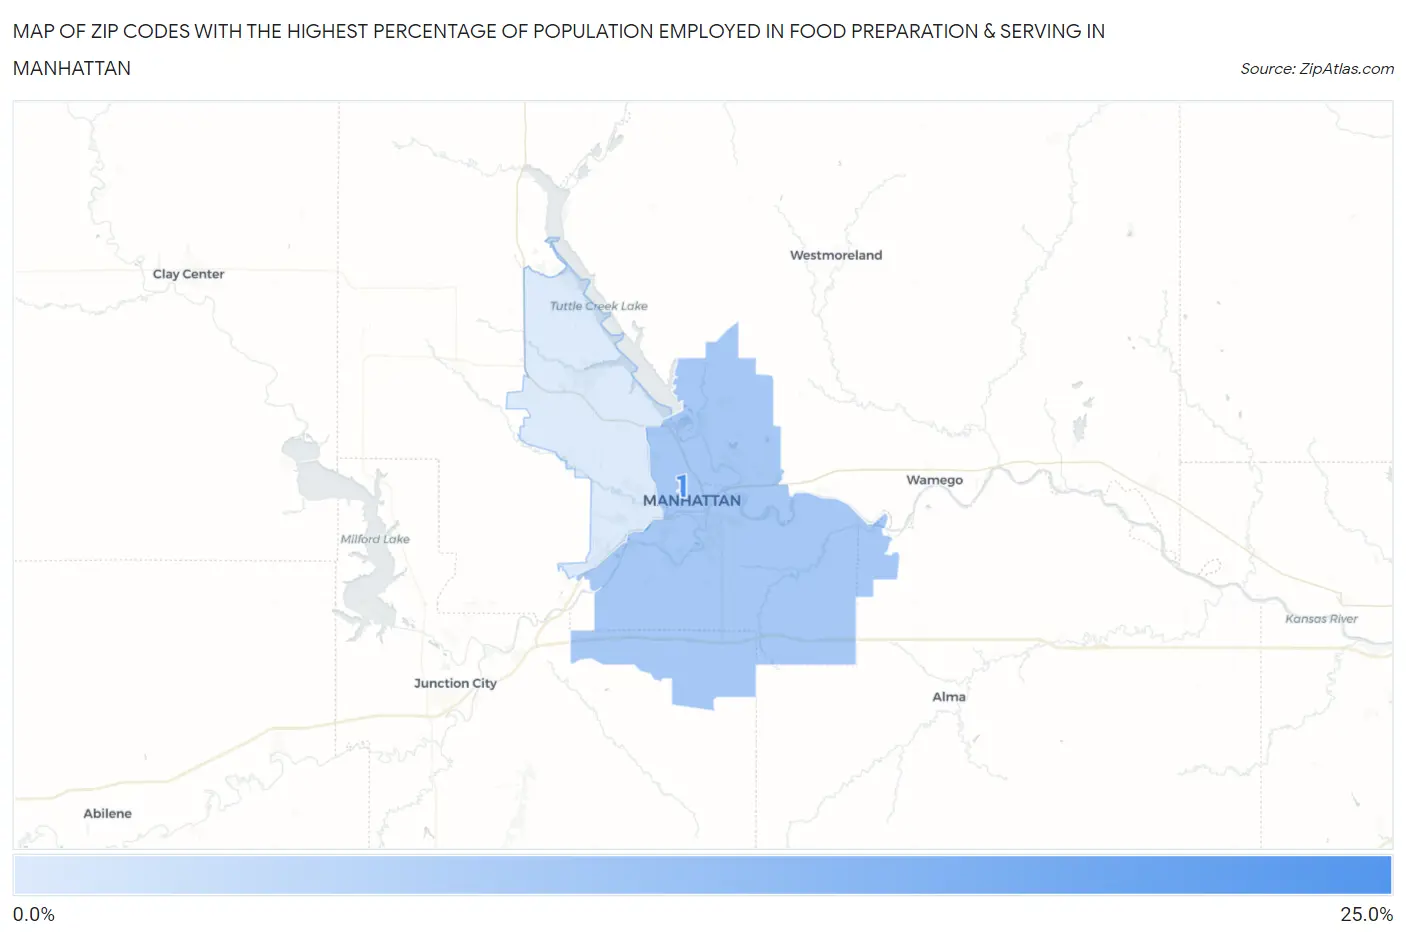
Map of Zip Codes with the Highest Percentage of Population Employed in Food Preparation & Serving in Manhattan
2.3%
21.4%
Zip Codes with the Highest Percentage of Population Employed in Food Preparation & Serving in Manhattan, KS
| Zip Code | % Employed | vs State | vs National | |
| 1. | 66506 | 21.4% | 5.2%(+16.2)#9 | 5.3%(+16.1)#442 |
| 2. | 66502 | 8.9% | 5.2%(+3.72)#60 | 5.3%(+3.63)#3,604 |
| 3. | 66503 | 2.3% | 5.2%(-2.88)#423 | 5.3%(-2.97)#23,729 |
1
Common Questions
What are the Top Zip Codes with the Highest Percentage of Population Employed in Food Preparation & Serving in Manhattan, KS?
Top Zip Codes with the Highest Percentage of Population Employed in Food Preparation & Serving in Manhattan, KS are:
What zip code has the Highest Percentage of Population Employed in Food Preparation & Serving in Manhattan, KS?
66506 has the Highest Percentage of Population Employed in Food Preparation & Serving in Manhattan, KS with 21.4%.
What is the Percentage of Population Employed in Food Preparation & Serving in Manhattan, KS?
Percentage of Population Employed in Food Preparation & Serving in Manhattan is 9.1%.
What is the Percentage of Population Employed in Food Preparation & Serving in Kansas?
Percentage of Population Employed in Food Preparation & Serving in Kansas is 5.2%.
What is the Percentage of Population Employed in Food Preparation & Serving in the United States?
Percentage of Population Employed in Food Preparation & Serving in the United States is 5.3%.