Zip Codes with the Highest Percentage of Population Employed in Food Preparation & Serving in Leawood, KS
RELATED REPORTS & OPTIONS
Food Preparation & Serving
Leawood
Compare Zip Codes
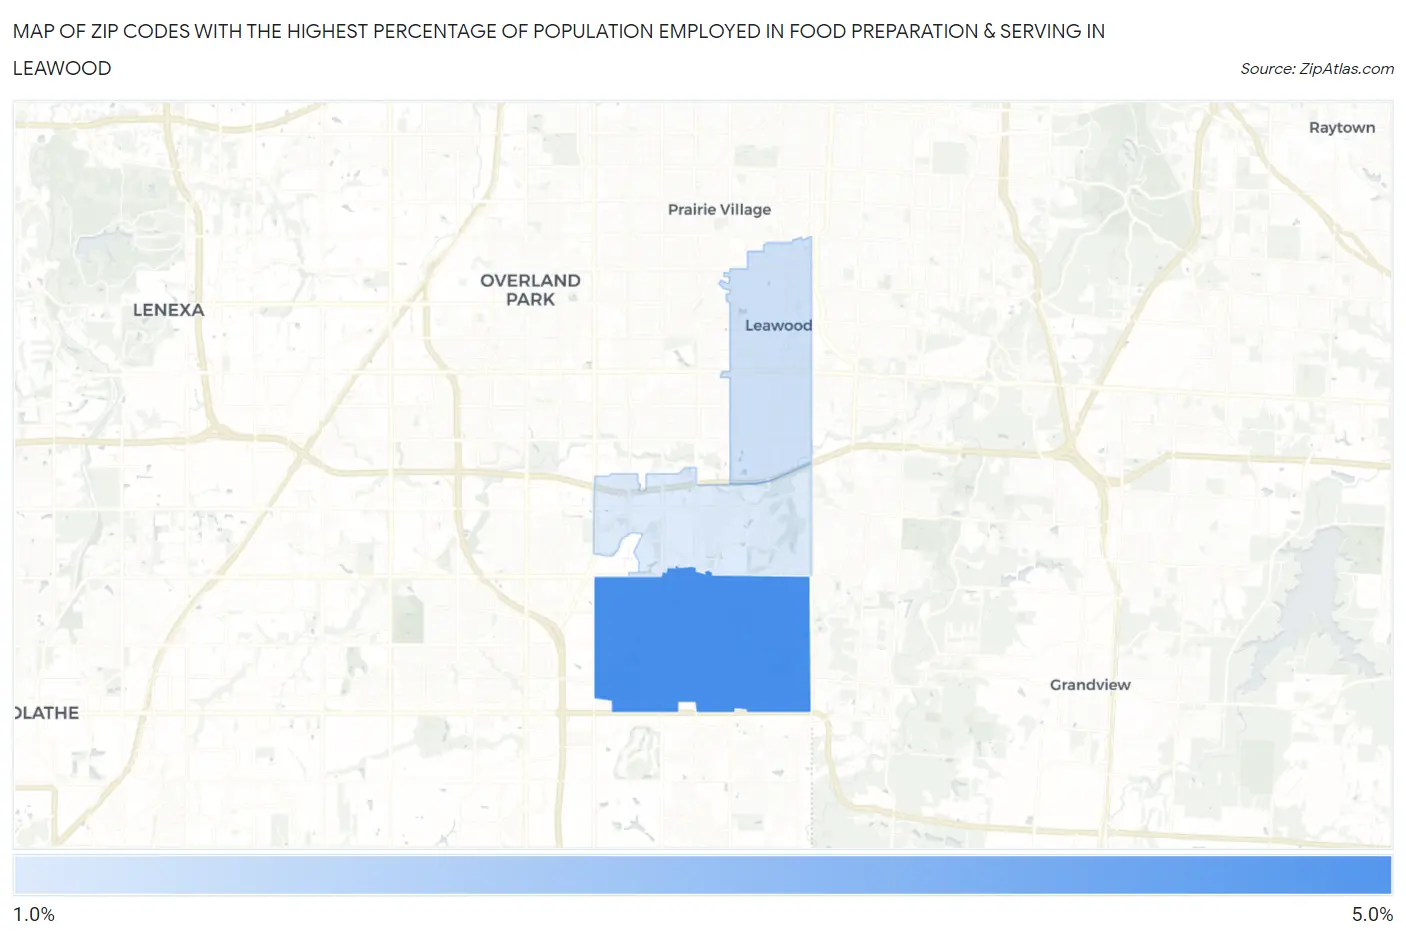
Map of Zip Codes with the Highest Percentage of Population Employed in Food Preparation & Serving in Leawood
1.8%
4.3%
Zip Codes with the Highest Percentage of Population Employed in Food Preparation & Serving in Leawood, KS
| Zip Code | % Employed | vs State | vs National | |
| 1. | 66209 | 4.3% | 5.2%(-0.856)#268 | 5.3%(-0.948)#15,711 |
| 2. | 66206 | 2.1% | 5.2%(-3.13)#446 | 5.3%(-3.22)#24,504 |
| 3. | 66211 | 1.8% | 5.2%(-3.35)#471 | 5.3%(-3.44)#25,163 |
1
Common Questions
What are the Top Zip Codes with the Highest Percentage of Population Employed in Food Preparation & Serving in Leawood, KS?
Top Zip Codes with the Highest Percentage of Population Employed in Food Preparation & Serving in Leawood, KS are:
What zip code has the Highest Percentage of Population Employed in Food Preparation & Serving in Leawood, KS?
66209 has the Highest Percentage of Population Employed in Food Preparation & Serving in Leawood, KS with 4.3%.
What is the Percentage of Population Employed in Food Preparation & Serving in Leawood, KS?
Percentage of Population Employed in Food Preparation & Serving in Leawood is 2.1%.
What is the Percentage of Population Employed in Food Preparation & Serving in Kansas?
Percentage of Population Employed in Food Preparation & Serving in Kansas is 5.2%.
What is the Percentage of Population Employed in Food Preparation & Serving in the United States?
Percentage of Population Employed in Food Preparation & Serving in the United States is 5.3%.