Zip Codes with the Highest Percentage of Population Employed in Food Preparation & Serving in Shawnee, KS
RELATED REPORTS & OPTIONS
Food Preparation & Serving
Shawnee
Compare Zip Codes
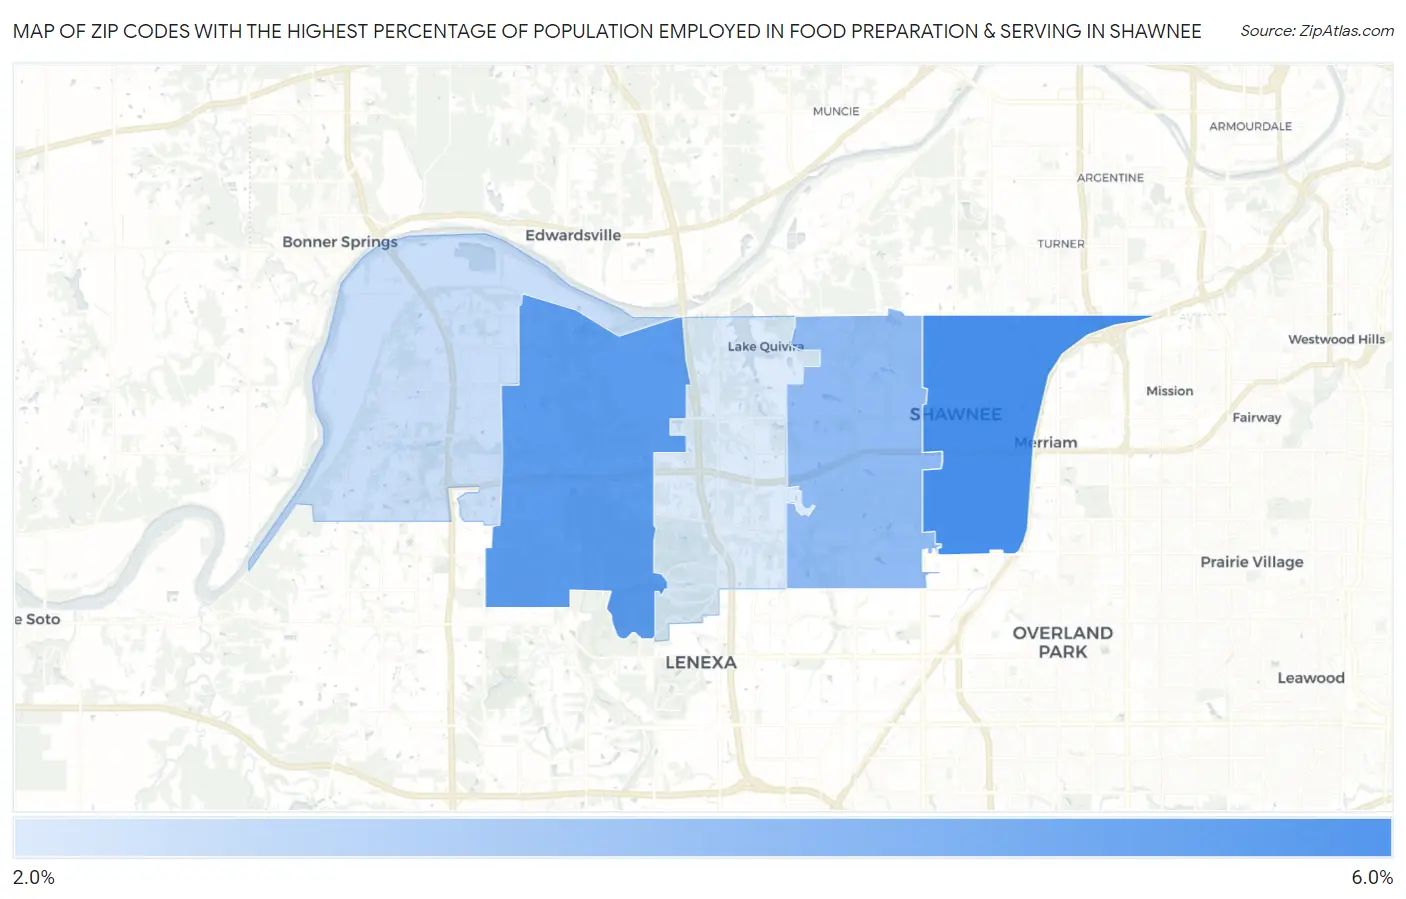
Map of Zip Codes with the Highest Percentage of Population Employed in Food Preparation & Serving in Shawnee
2.2%
5.7%
Zip Codes with the Highest Percentage of Population Employed in Food Preparation & Serving in Shawnee, KS
| Zip Code | % Employed | vs State | vs National | |
| 1. | 66203 | 5.7% | 5.2%(+0.528)#170 | 5.3%(+0.436)#10,265 |
| 2. | 66218 | 5.3% | 5.2%(+0.067)#201 | 5.3%(-0.025)#11,919 |
| 3. | 66216 | 4.0% | 5.2%(-1.17)#296 | 5.3%(-1.26)#17,042 |
| 4. | 66226 | 2.7% | 5.2%(-2.52)#399 | 5.3%(-2.61)#22,514 |
| 5. | 66217 | 2.2% | 5.2%(-3.01)#435 | 5.3%(-3.10)#24,135 |
1
Common Questions
What are the Top 3 Zip Codes with the Highest Percentage of Population Employed in Food Preparation & Serving in Shawnee, KS?
Top 3 Zip Codes with the Highest Percentage of Population Employed in Food Preparation & Serving in Shawnee, KS are:
What zip code has the Highest Percentage of Population Employed in Food Preparation & Serving in Shawnee, KS?
66203 has the Highest Percentage of Population Employed in Food Preparation & Serving in Shawnee, KS with 5.7%.
What is the Percentage of Population Employed in Food Preparation & Serving in Shawnee, KS?
Percentage of Population Employed in Food Preparation & Serving in Shawnee is 4.5%.
What is the Percentage of Population Employed in Food Preparation & Serving in Kansas?
Percentage of Population Employed in Food Preparation & Serving in Kansas is 5.2%.
What is the Percentage of Population Employed in Food Preparation & Serving in the United States?
Percentage of Population Employed in Food Preparation & Serving in the United States is 5.3%.