Zip Codes with the Highest Percentage of Population Employed in Food Preparation & Serving in Topeka, KS
RELATED REPORTS & OPTIONS
Food Preparation & Serving
Topeka
Compare Zip Codes
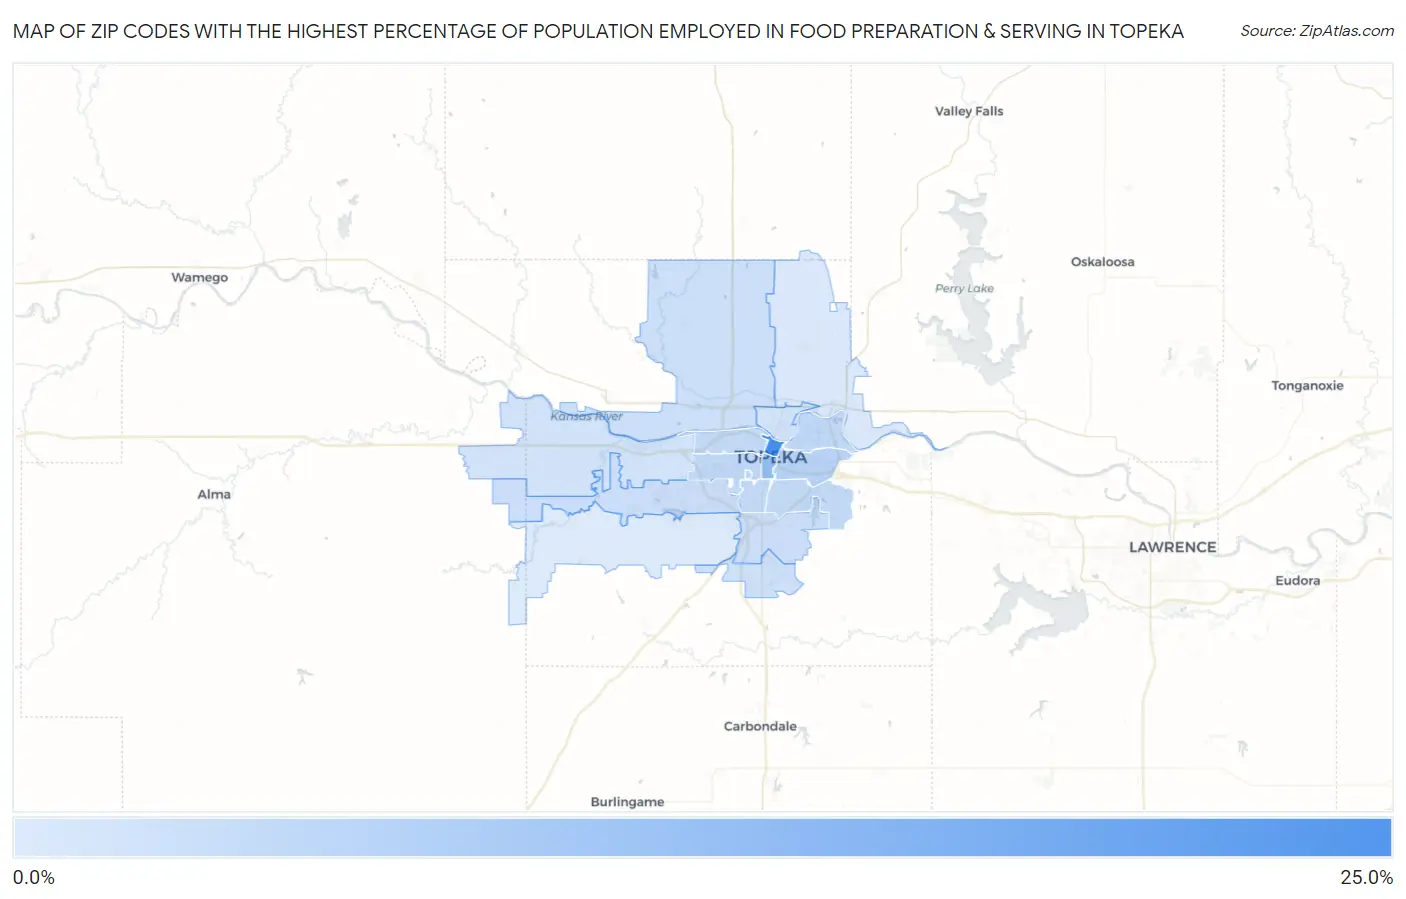
Map of Zip Codes with the Highest Percentage of Population Employed in Food Preparation & Serving in Topeka
2.0%
22.9%
Zip Codes with the Highest Percentage of Population Employed in Food Preparation & Serving in Topeka, KS
| Zip Code | % Employed | vs State | vs National | |
| 1. | 66603 | 22.9% | 5.2%(+17.7)#7 | 5.3%(+17.6)#386 |
| 2. | 66612 | 11.8% | 5.2%(+6.62)#27 | 5.3%(+6.53)#1,731 |
| 3. | 66607 | 6.9% | 5.2%(+1.66)#115 | 5.3%(+1.57)#6,923 |
| 4. | 66604 | 5.7% | 5.2%(+0.510)#171 | 5.3%(+0.418)#10,322 |
| 5. | 66621 | 5.7% | 5.2%(+0.508)#173 | 5.3%(+0.416)#10,334 |
| 6. | 66616 | 5.5% | 5.2%(+0.270)#182 | 5.3%(+0.178)#11,168 |
| 7. | 66605 | 5.3% | 5.2%(+0.096)#197 | 5.3%(+0.004)#11,808 |
| 8. | 66606 | 5.3% | 5.2%(+0.087)#199 | 5.3%(-0.005)#11,836 |
| 9. | 66611 | 5.2% | 5.2%(-0.015)#209 | 5.3%(-0.107)#12,245 |
| 10. | 66609 | 4.4% | 5.2%(-0.761)#257 | 5.3%(-0.854)#15,280 |
| 11. | 66614 | 4.4% | 5.2%(-0.804)#261 | 5.3%(-0.897)#15,462 |
| 12. | 66618 | 4.2% | 5.2%(-1.03)#283 | 5.3%(-1.12)#16,453 |
| 13. | 66619 | 3.8% | 5.2%(-1.39)#320 | 5.3%(-1.48)#17,939 |
| 14. | 66608 | 3.5% | 5.2%(-1.70)#343 | 5.3%(-1.79)#19,227 |
| 15. | 66615 | 3.3% | 5.2%(-1.87)#357 | 5.3%(-1.96)#19,951 |
| 16. | 66617 | 2.4% | 5.2%(-2.78)#416 | 5.3%(-2.88)#23,428 |
| 17. | 66610 | 2.0% | 5.2%(-3.19)#457 | 5.3%(-3.29)#24,711 |
1
Common Questions
What are the Top 10 Zip Codes with the Highest Percentage of Population Employed in Food Preparation & Serving in Topeka, KS?
Top 10 Zip Codes with the Highest Percentage of Population Employed in Food Preparation & Serving in Topeka, KS are:
What zip code has the Highest Percentage of Population Employed in Food Preparation & Serving in Topeka, KS?
66603 has the Highest Percentage of Population Employed in Food Preparation & Serving in Topeka, KS with 22.9%.
What is the Percentage of Population Employed in Food Preparation & Serving in Topeka, KS?
Percentage of Population Employed in Food Preparation & Serving in Topeka is 5.6%.
What is the Percentage of Population Employed in Food Preparation & Serving in Kansas?
Percentage of Population Employed in Food Preparation & Serving in Kansas is 5.2%.
What is the Percentage of Population Employed in Food Preparation & Serving in the United States?
Percentage of Population Employed in Food Preparation & Serving in the United States is 5.3%.