Zip Codes with the Highest Percentage of Population Employed in Arts, Entertainment & Recreation in Fishers, IN
RELATED REPORTS & OPTIONS
Arts, Entertainment & Recreation
Fishers
Compare Zip Codes
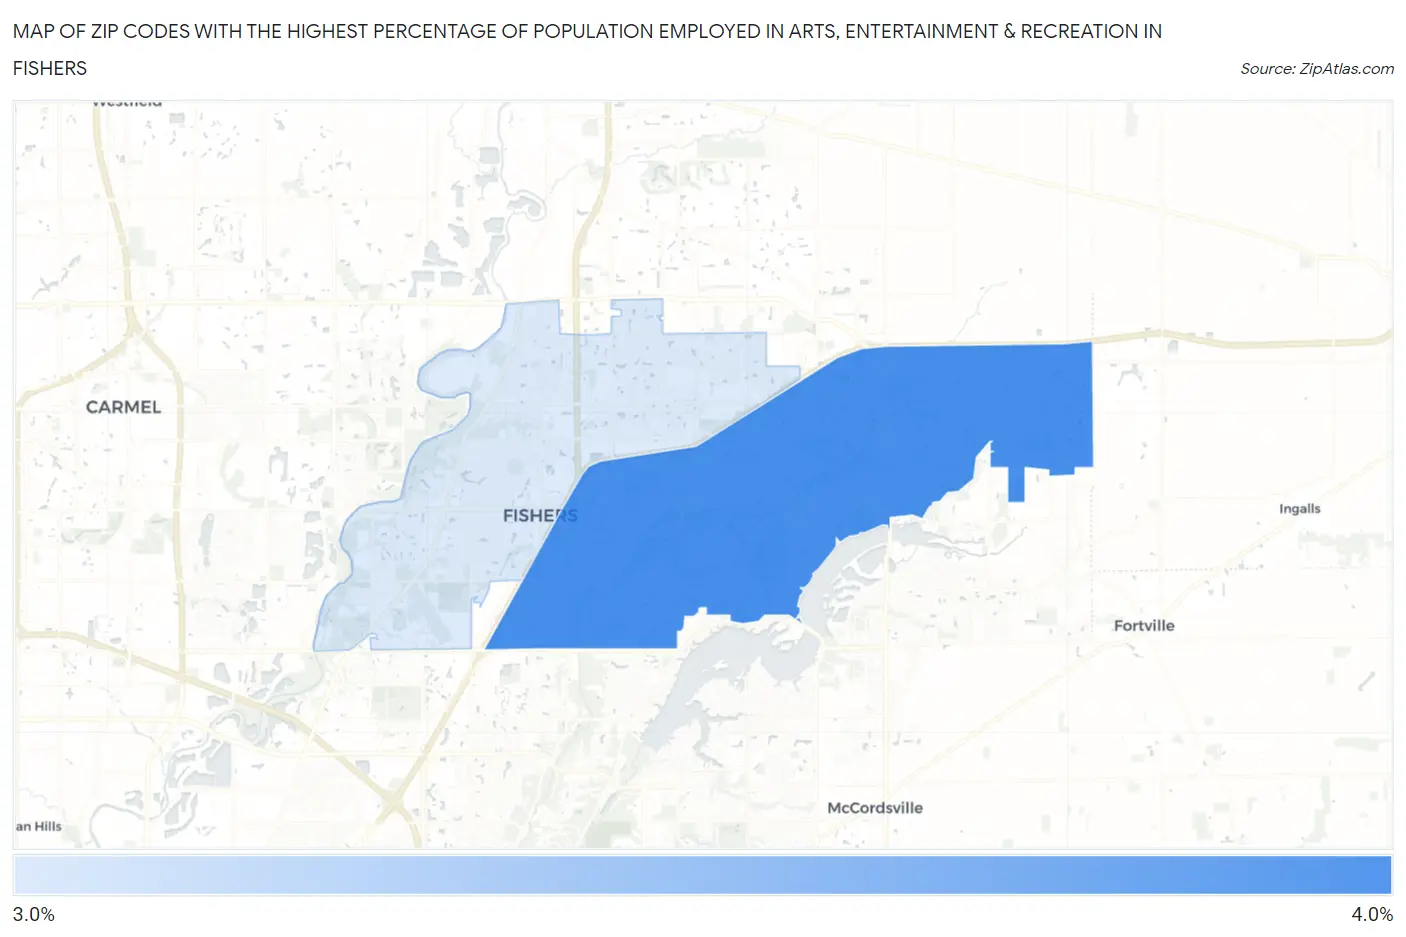
Map of Zip Codes with the Highest Percentage of Population Employed in Arts, Entertainment & Recreation in Fishers
3.3%
3.3%
Zip Codes with the Highest Percentage of Population Employed in Arts, Entertainment & Recreation in Fishers, IN
| Zip Code | % Employed | vs State | vs National | |
| 1. | 46037 | 3.3% | 1.6%(+1.71)#59 | 2.1%(+1.27)#4,468 |
| 2. | 46038 | 3.3% | 1.6%(+1.68)#61 | 2.1%(+1.24)#4,528 |
1
Common Questions
What are the Top Zip Codes with the Highest Percentage of Population Employed in Arts, Entertainment & Recreation in Fishers, IN?
Top Zip Codes with the Highest Percentage of Population Employed in Arts, Entertainment & Recreation in Fishers, IN are:
What zip code has the Highest Percentage of Population Employed in Arts, Entertainment & Recreation in Fishers, IN?
46037 has the Highest Percentage of Population Employed in Arts, Entertainment & Recreation in Fishers, IN with 3.3%.
What is the Percentage of Population Employed in Arts, Entertainment & Recreation in Fishers, IN?
Percentage of Population Employed in Arts, Entertainment & Recreation in Fishers is 3.2%.
What is the Percentage of Population Employed in Arts, Entertainment & Recreation in Indiana?
Percentage of Population Employed in Arts, Entertainment & Recreation in Indiana is 1.6%.
What is the Percentage of Population Employed in Arts, Entertainment & Recreation in the United States?
Percentage of Population Employed in Arts, Entertainment & Recreation in the United States is 2.1%.