Zip Codes with the Highest Percentage of Population Employed in Health Diagnosing & Treating in Tinley Park, IL
RELATED REPORTS & OPTIONS
Health Diagnosing & Treating
Tinley Park
Compare Zip Codes
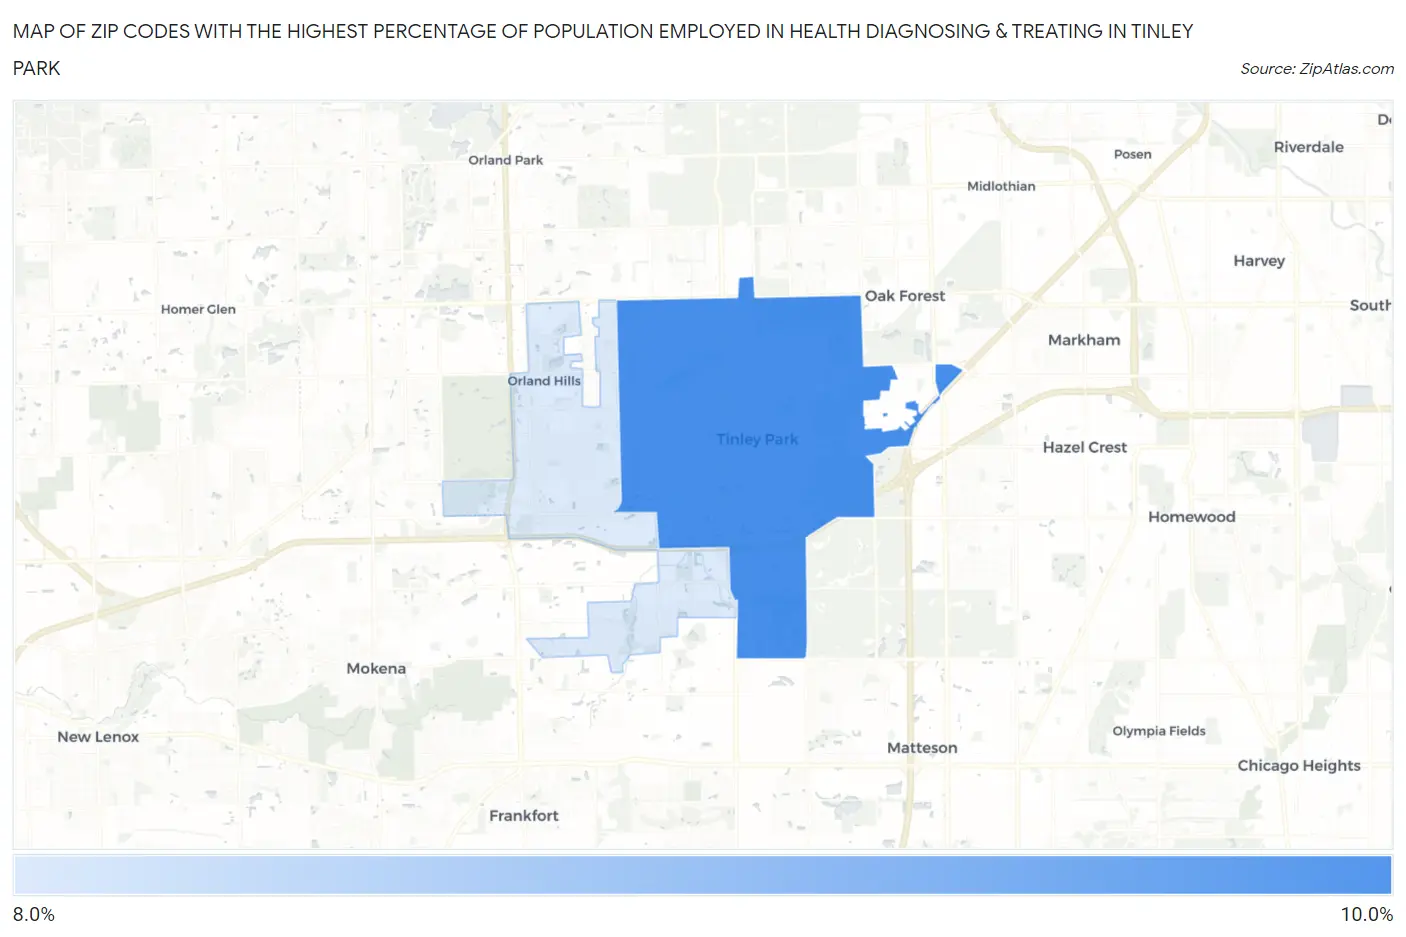
Map of Zip Codes with the Highest Percentage of Population Employed in Health Diagnosing & Treating in Tinley Park
8.2%
8.3%
Zip Codes with the Highest Percentage of Population Employed in Health Diagnosing & Treating in Tinley Park, IL
| Zip Code | % Employed | vs State | vs National | |
| 1. | 60477 | 8.3% | 6.2%(+2.09)#331 | 6.2%(+2.08)#6,719 |
| 2. | 60487 | 8.2% | 6.2%(+1.95)#353 | 6.2%(+1.94)#7,051 |
1
Common Questions
What are the Top Zip Codes with the Highest Percentage of Population Employed in Health Diagnosing & Treating in Tinley Park, IL?
Top Zip Codes with the Highest Percentage of Population Employed in Health Diagnosing & Treating in Tinley Park, IL are:
What zip code has the Highest Percentage of Population Employed in Health Diagnosing & Treating in Tinley Park, IL?
60477 has the Highest Percentage of Population Employed in Health Diagnosing & Treating in Tinley Park, IL with 8.3%.
What is the Percentage of Population Employed in Health Diagnosing & Treating in Tinley Park, IL?
Percentage of Population Employed in Health Diagnosing & Treating in Tinley Park is 8.9%.
What is the Percentage of Population Employed in Health Diagnosing & Treating in Illinois?
Percentage of Population Employed in Health Diagnosing & Treating in Illinois is 6.2%.
What is the Percentage of Population Employed in Health Diagnosing & Treating in the United States?
Percentage of Population Employed in Health Diagnosing & Treating in the United States is 6.2%.