Zip Codes with the Highest Percentage of Population Employed in Computer & Mathematics in Peoria, IL
RELATED REPORTS & OPTIONS
Computer & Mathematics
Peoria
Compare Zip Codes
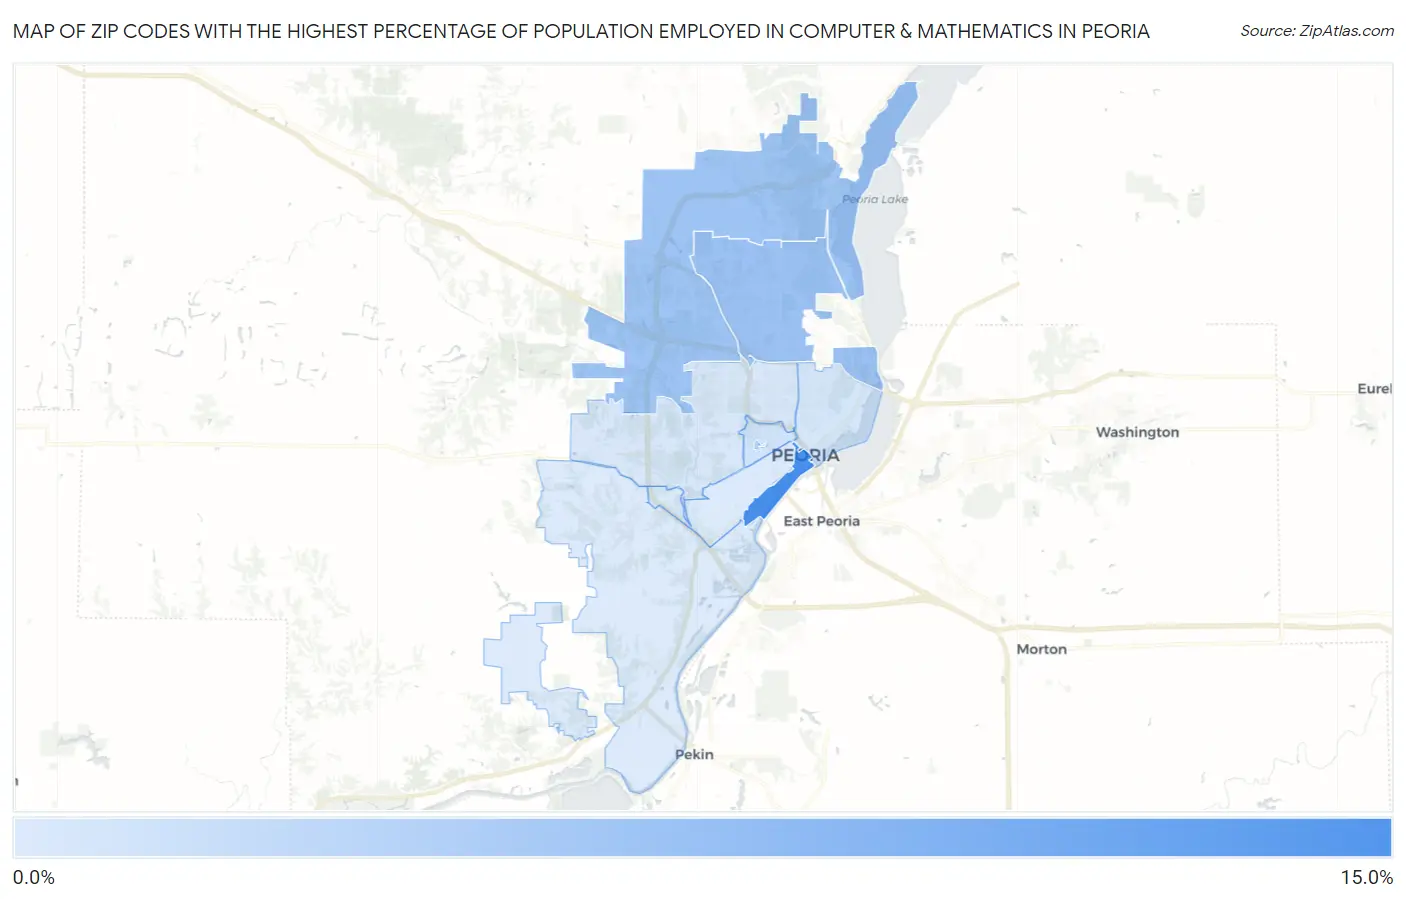
Map of Zip Codes with the Highest Percentage of Population Employed in Computer & Mathematics in Peoria
0.98%
11.1%
Zip Codes with the Highest Percentage of Population Employed in Computer & Mathematics in Peoria, IL
| Zip Code | % Employed | vs State | vs National | |
| 1. | 61602 | 11.1% | 3.6%(+7.55)#22 | 3.5%(+7.59)#547 |
| 2. | 61614 | 5.2% | 3.6%(+1.65)#132 | 3.5%(+1.69)#3,109 |
| 3. | 61615 | 5.0% | 3.6%(+1.43)#146 | 3.5%(+1.47)#3,367 |
| 4. | 61625 | 3.3% | 3.6%(-0.252)#283 | 3.5%(-0.213)#6,742 |
| 5. | 61606 | 1.8% | 3.6%(-1.78)#519 | 3.5%(-1.74)#12,834 |
| 6. | 61603 | 1.5% | 3.6%(-2.07)#594 | 3.5%(-2.03)#14,396 |
| 7. | 61604 | 1.3% | 3.6%(-2.30)#664 | 3.5%(-2.26)#15,750 |
| 8. | 61605 | 1.0% | 3.6%(-2.56)#750 | 3.5%(-2.52)#17,386 |
| 9. | 61607 | 0.98% | 3.6%(-2.59)#757 | 3.5%(-2.55)#17,515 |
1
Common Questions
What are the Top 5 Zip Codes with the Highest Percentage of Population Employed in Computer & Mathematics in Peoria, IL?
Top 5 Zip Codes with the Highest Percentage of Population Employed in Computer & Mathematics in Peoria, IL are:
What zip code has the Highest Percentage of Population Employed in Computer & Mathematics in Peoria, IL?
61602 has the Highest Percentage of Population Employed in Computer & Mathematics in Peoria, IL with 11.1%.
What is the Percentage of Population Employed in Computer & Mathematics in Peoria, IL?
Percentage of Population Employed in Computer & Mathematics in Peoria is 3.6%.
What is the Percentage of Population Employed in Computer & Mathematics in Illinois?
Percentage of Population Employed in Computer & Mathematics in Illinois is 3.6%.
What is the Percentage of Population Employed in Computer & Mathematics in the United States?
Percentage of Population Employed in Computer & Mathematics in the United States is 3.5%.