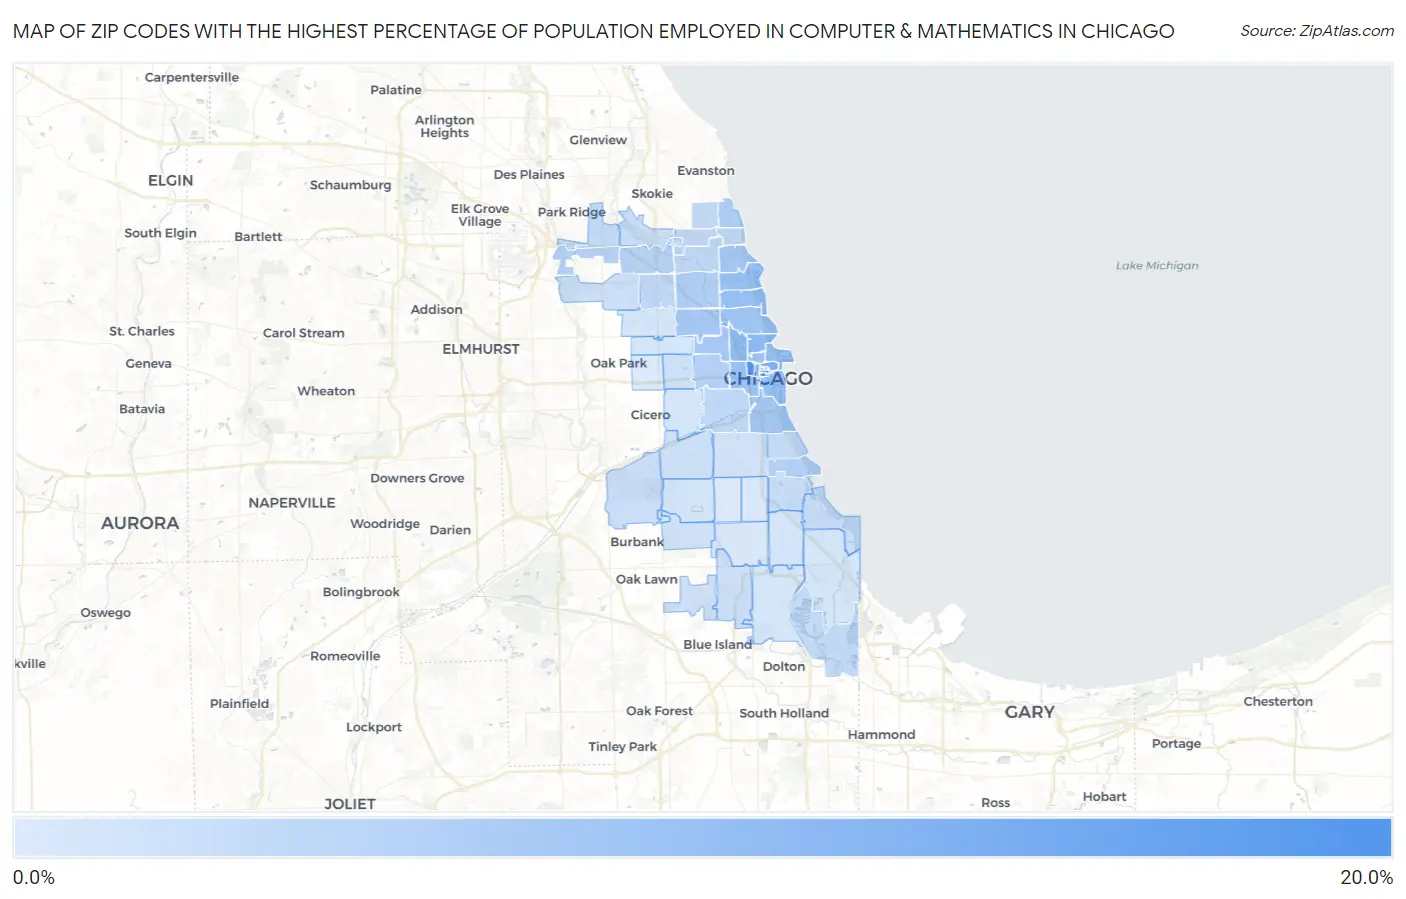
Zip Codes with the Highest Percentage of Population Employed in Computer & Mathematics in Chicago, IL
RELATED REPORTS & OPTIONS
Computer & Mathematics
Chicago
Compare Zip Codes
Map of Zip Codes with the Highest Percentage of Population Employed in Computer & Mathematics in Chicago
0.75%
16.7%
Zip Codes with the Highest Percentage of Population Employed in Computer & Mathematics in Chicago, IL
| Zip Code | % Employed | vs State | vs National | |
| 1. | 60604 | 16.7% | 3.6%(+13.2)#7 | 3.5%(+13.2)#195 |
| 2. | 60661 | 15.5% | 3.6%(+11.9)#8 | 3.5%(+11.9)#231 |
| 3. | 60603 | 11.3% | 3.6%(+7.73)#21 | 3.5%(+7.77)#520 |
| 4. | 60601 | 10.3% | 3.6%(+6.71)#24 | 3.5%(+6.75)#664 |
| 5. | 60602 | 9.7% | 3.6%(+6.16)#28 | 3.5%(+6.20)#752 |
| 6. | 60610 | 8.7% | 3.6%(+5.14)#38 | 3.5%(+5.17)#991 |
| 7. | 60642 | 8.6% | 3.6%(+5.06)#39 | 3.5%(+5.10)#1,015 |
| 8. | 60611 | 8.0% | 3.6%(+4.46)#46 | 3.5%(+4.50)#1,200 |
| 9. | 60657 | 7.9% | 3.6%(+4.31)#47 | 3.5%(+4.35)#1,245 |
| 10. | 60605 | 7.9% | 3.6%(+4.31)#48 | 3.5%(+4.35)#1,246 |
| 11. | 60613 | 7.7% | 3.6%(+4.17)#50 | 3.5%(+4.21)#1,307 |
| 12. | 60607 | 7.7% | 3.6%(+4.09)#51 | 3.5%(+4.13)#1,331 |
| 13. | 60606 | 7.6% | 3.6%(+4.03)#52 | 3.5%(+4.07)#1,353 |
| 14. | 60654 | 7.4% | 3.6%(+3.87)#54 | 3.5%(+3.91)#1,412 |
| 15. | 60614 | 7.2% | 3.6%(+3.62)#58 | 3.5%(+3.65)#1,527 |
| 16. | 60616 | 6.6% | 3.6%(+3.04)#72 | 3.5%(+3.08)#1,859 |
| 17. | 60647 | 6.5% | 3.6%(+2.91)#78 | 3.5%(+2.95)#1,948 |
| 18. | 60622 | 6.4% | 3.6%(+2.86)#79 | 3.5%(+2.90)#1,988 |
| 19. | 60640 | 6.4% | 3.6%(+2.81)#82 | 3.5%(+2.85)#2,020 |
| 20. | 60626 | 5.5% | 3.6%(+1.95)#117 | 3.5%(+1.98)#2,776 |
| 21. | 60618 | 5.1% | 3.6%(+1.57)#135 | 3.5%(+1.61)#3,196 |
| 22. | 60612 | 4.9% | 3.6%(+1.34)#151 | 3.5%(+1.38)#3,498 |
| 23. | 60615 | 4.6% | 3.6%(+1.07)#167 | 3.5%(+1.10)#3,899 |
| 24. | 60630 | 4.5% | 3.6%(+0.897)#175 | 3.5%(+0.935)#4,157 |
| 25. | 60656 | 4.4% | 3.6%(+0.819)#184 | 3.5%(+0.857)#4,295 |
| 26. | 60608 | 3.8% | 3.6%(+0.238)#233 | 3.5%(+0.276)#5,476 |
| 27. | 60660 | 3.7% | 3.6%(+0.134)#244 | 3.5%(+0.172)#5,737 |
| 28. | 60641 | 3.6% | 3.6%(-0.009)#258 | 3.5%(+0.030)#6,062 |
| 29. | 60625 | 3.5% | 3.6%(-0.045)#260 | 3.5%(-0.007)#6,161 |
| 30. | 60659 | 3.5% | 3.6%(-0.104)#267 | 3.5%(-0.066)#6,313 |
| 31. | 60645 | 3.4% | 3.6%(-0.160)#271 | 3.5%(-0.122)#6,478 |
| 32. | 60633 | 3.4% | 3.6%(-0.207)#275 | 3.5%(-0.169)#6,602 |
| 33. | 60631 | 3.1% | 3.6%(-0.429)#303 | 3.5%(-0.391)#7,318 |
| 34. | 60637 | 2.9% | 3.6%(-0.635)#331 | 3.5%(-0.596)#8,006 |
| 35. | 60653 | 2.9% | 3.6%(-0.658)#333 | 3.5%(-0.620)#8,083 |
| 36. | 60649 | 2.8% | 3.6%(-0.769)#352 | 3.5%(-0.731)#8,468 |
| 37. | 60638 | 2.5% | 3.6%(-1.04)#391 | 3.5%(-1.00)#9,555 |
| 38. | 60643 | 2.4% | 3.6%(-1.11)#403 | 3.5%(-1.07)#9,845 |
| 39. | 60646 | 2.4% | 3.6%(-1.13)#404 | 3.5%(-1.09)#9,893 |
| 40. | 60634 | 2.4% | 3.6%(-1.18)#411 | 3.5%(-1.14)#10,111 |
| 41. | 60624 | 2.1% | 3.6%(-1.45)#448 | 3.5%(-1.41)#11,276 |
| 42. | 60632 | 2.0% | 3.6%(-1.55)#466 | 3.5%(-1.51)#11,754 |
| 43. | 60655 | 2.0% | 3.6%(-1.61)#480 | 3.5%(-1.57)#12,027 |
| 44. | 60652 | 1.9% | 3.6%(-1.67)#496 | 3.5%(-1.63)#12,317 |
| 45. | 60609 | 1.9% | 3.6%(-1.67)#501 | 3.5%(-1.64)#12,355 |
| 46. | 60619 | 1.6% | 3.6%(-1.96)#565 | 3.5%(-1.92)#13,789 |
| 47. | 60639 | 1.5% | 3.6%(-2.03)#581 | 3.5%(-1.99)#14,175 |
| 48. | 60651 | 1.5% | 3.6%(-2.03)#583 | 3.5%(-2.00)#14,200 |
| 49. | 60623 | 1.5% | 3.6%(-2.10)#607 | 3.5%(-2.06)#14,591 |
| 50. | 60629 | 1.5% | 3.6%(-2.10)#609 | 3.5%(-2.06)#14,606 |
| 51. | 60628 | 1.4% | 3.6%(-2.16)#624 | 3.5%(-2.12)#14,904 |
| 52. | 60617 | 1.4% | 3.6%(-2.20)#632 | 3.5%(-2.16)#15,156 |
| 53. | 60620 | 1.3% | 3.6%(-2.31)#667 | 3.5%(-2.27)#15,820 |
| 54. | 60621 | 0.91% | 3.6%(-2.65)#773 | 3.5%(-2.61)#17,941 |
| 55. | 60644 | 0.81% | 3.6%(-2.75)#804 | 3.5%(-2.71)#18,563 |
| 56. | 60636 | 0.75% | 3.6%(-2.82)#820 | 3.5%(-2.78)#18,979 |
1
Common Questions
What are the Top 10 Zip Codes with the Highest Percentage of Population Employed in Computer & Mathematics in Chicago, IL?
Top 10 Zip Codes with the Highest Percentage of Population Employed in Computer & Mathematics in Chicago, IL are:
What zip code has the Highest Percentage of Population Employed in Computer & Mathematics in Chicago, IL?
60604 has the Highest Percentage of Population Employed in Computer & Mathematics in Chicago, IL with 16.7%.
What is the Percentage of Population Employed in Computer & Mathematics in Chicago, IL?
Percentage of Population Employed in Computer & Mathematics in Chicago is 4.3%.
What is the Percentage of Population Employed in Computer & Mathematics in Illinois?
Percentage of Population Employed in Computer & Mathematics in Illinois is 3.6%.
What is the Percentage of Population Employed in Computer & Mathematics in the United States?
Percentage of Population Employed in Computer & Mathematics in the United States is 3.5%.