Zip Codes with the Highest Percentage of Population Employed in Computer & Mathematics in Wheaton, IL
RELATED REPORTS & OPTIONS
Computer & Mathematics
Wheaton
Compare Zip Codes
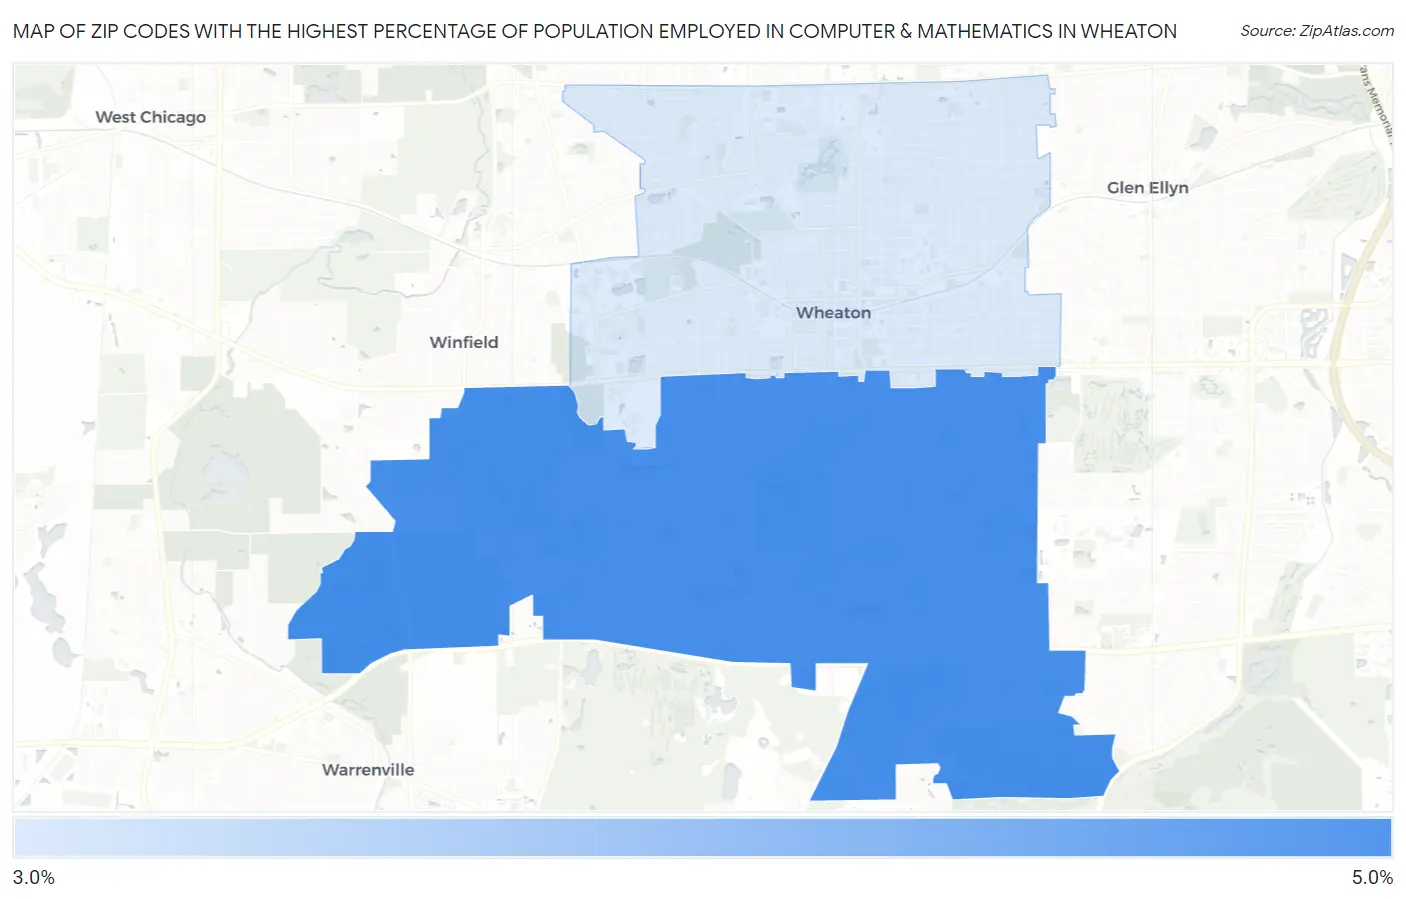
Map of Zip Codes with the Highest Percentage of Population Employed in Computer & Mathematics in Wheaton
3.9%
4.0%
Zip Codes with the Highest Percentage of Population Employed in Computer & Mathematics in Wheaton, IL
| Zip Code | % Employed | vs State | vs National | |
| 1. | 60189 | 4.0% | 3.6%(+0.478)#207 | 3.5%(+0.516)#4,942 |
| 2. | 60187 | 3.9% | 3.6%(+0.366)#216 | 3.5%(+0.404)#5,193 |
1
Common Questions
What are the Top Zip Codes with the Highest Percentage of Population Employed in Computer & Mathematics in Wheaton, IL?
Top Zip Codes with the Highest Percentage of Population Employed in Computer & Mathematics in Wheaton, IL are:
What zip code has the Highest Percentage of Population Employed in Computer & Mathematics in Wheaton, IL?
60189 has the Highest Percentage of Population Employed in Computer & Mathematics in Wheaton, IL with 4.0%.
What is the Percentage of Population Employed in Computer & Mathematics in Wheaton, IL?
Percentage of Population Employed in Computer & Mathematics in Wheaton is 4.1%.
What is the Percentage of Population Employed in Computer & Mathematics in Illinois?
Percentage of Population Employed in Computer & Mathematics in Illinois is 3.6%.
What is the Percentage of Population Employed in Computer & Mathematics in the United States?
Percentage of Population Employed in Computer & Mathematics in the United States is 3.5%.