Zip Codes with the Highest Percentage of Population Employed in Community & Social Service in Fairfield, IA
RELATED REPORTS & OPTIONS
Community & Social Service
Fairfield
Compare Zip Codes
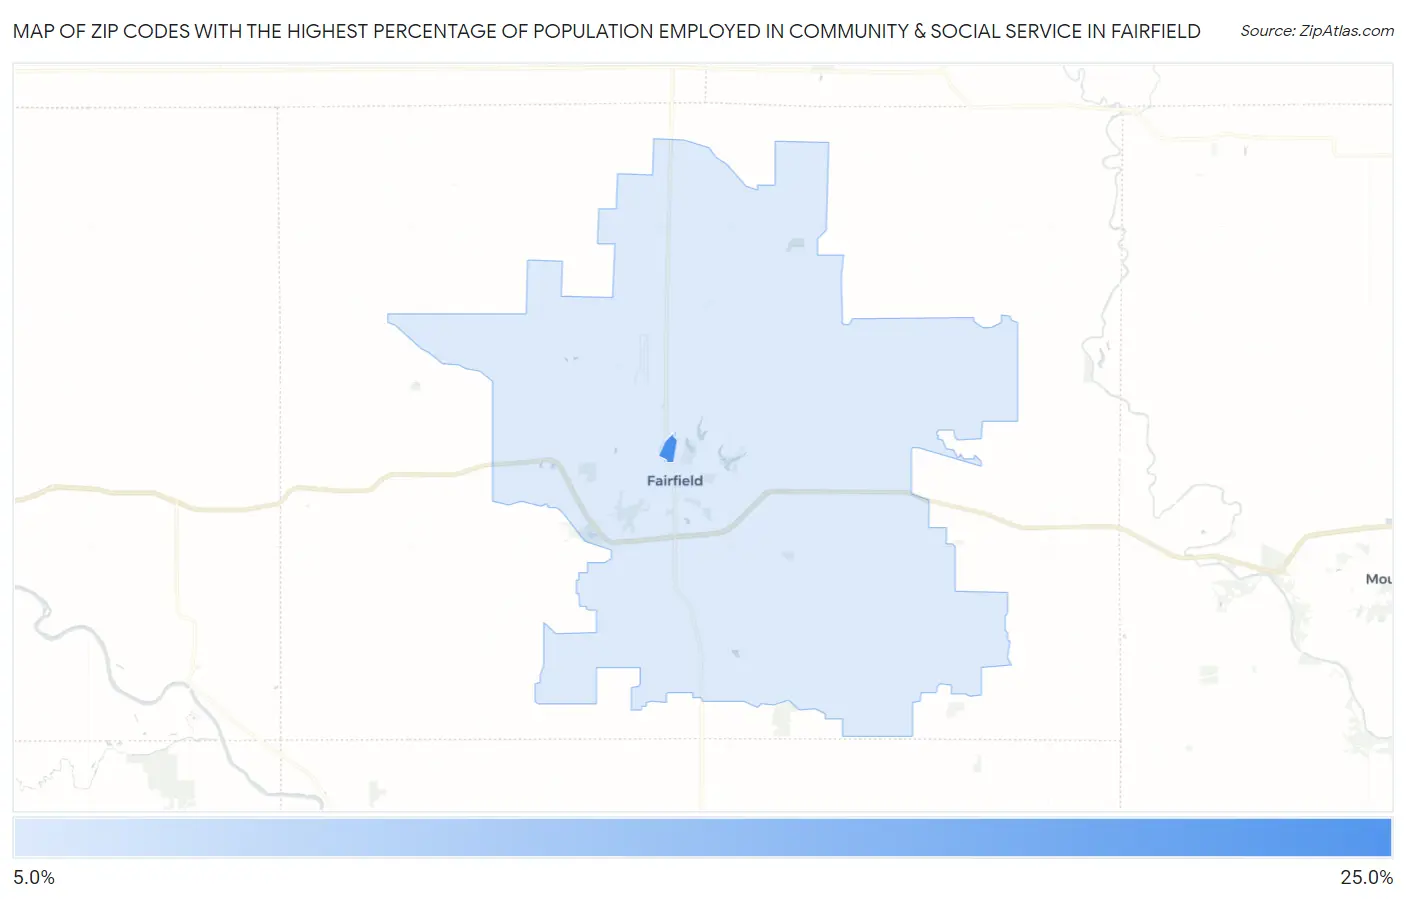
Map of Zip Codes with the Highest Percentage of Population Employed in Community & Social Service in Fairfield
12.8%
23.4%
Zip Codes with the Highest Percentage of Population Employed in Community & Social Service in Fairfield, IA
| Zip Code | % Employed | vs State | vs National | |
| 1. | 52557 | 23.4% | 10.3%(+13.0)#18 | 11.2%(+12.2)#1,221 |
| 2. | 52556 | 12.8% | 10.3%(+2.52)#123 | 11.2%(+1.63)#7,809 |
1
Common Questions
What are the Top Zip Codes with the Highest Percentage of Population Employed in Community & Social Service in Fairfield, IA?
Top Zip Codes with the Highest Percentage of Population Employed in Community & Social Service in Fairfield, IA are:
What zip code has the Highest Percentage of Population Employed in Community & Social Service in Fairfield, IA?
52557 has the Highest Percentage of Population Employed in Community & Social Service in Fairfield, IA with 23.4%.
What is the Percentage of Population Employed in Community & Social Service in Fairfield, IA?
Percentage of Population Employed in Community & Social Service in Fairfield is 14.8%.
What is the Percentage of Population Employed in Community & Social Service in Iowa?
Percentage of Population Employed in Community & Social Service in Iowa is 10.3%.
What is the Percentage of Population Employed in Community & Social Service in the United States?
Percentage of Population Employed in Community & Social Service in the United States is 11.2%.