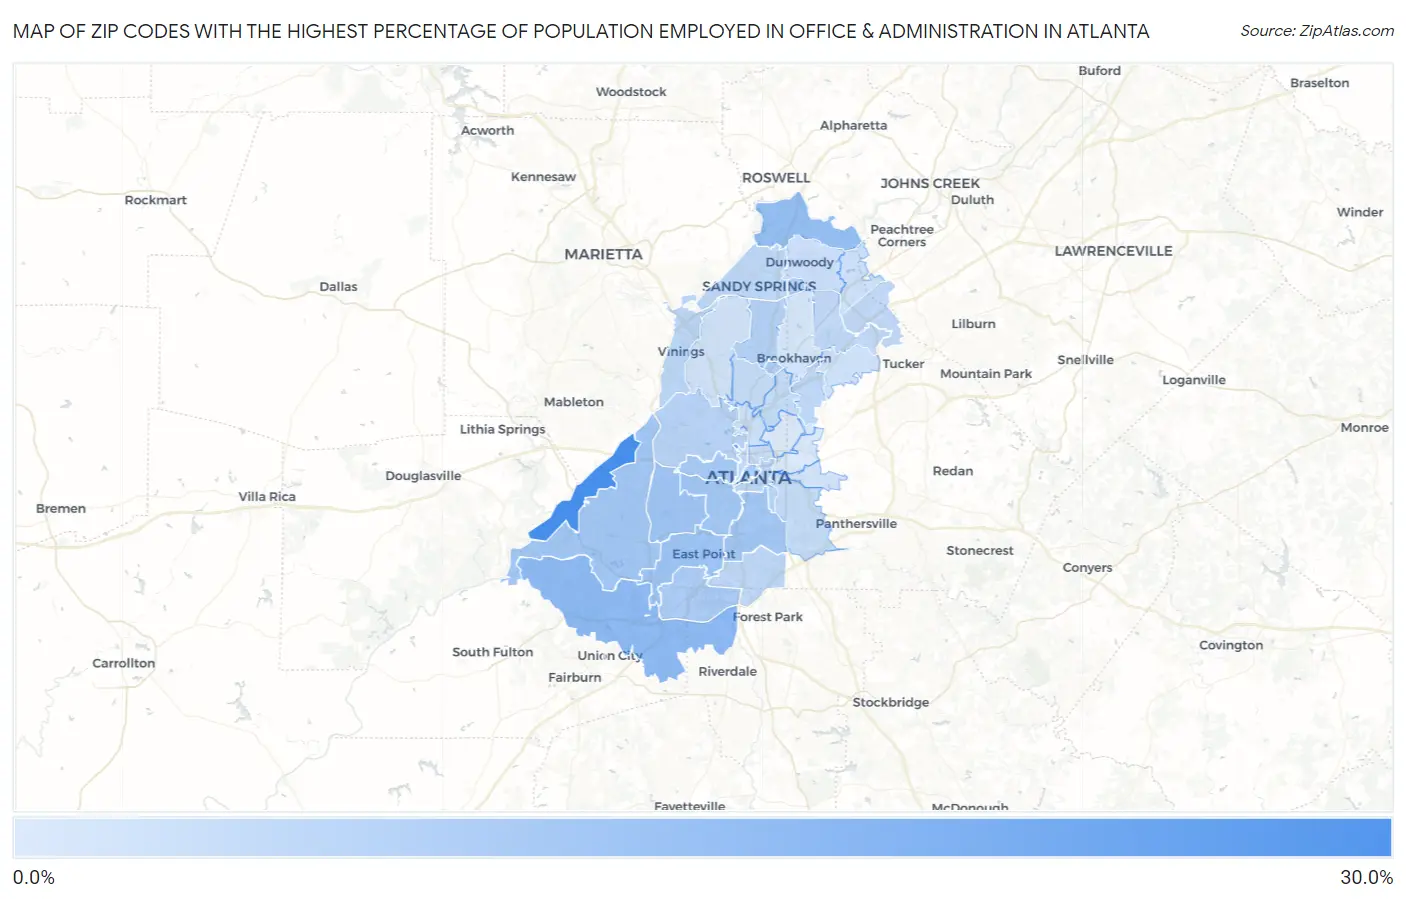
Zip Codes with the Highest Percentage of Population Employed in Office & Administration in Atlanta, GA
RELATED REPORTS & OPTIONS
Office & Administration
Atlanta
Compare Zip Codes
Map of Zip Codes with the Highest Percentage of Population Employed in Office & Administration in Atlanta
3.9%
28.3%
Zip Codes with the Highest Percentage of Population Employed in Office & Administration in Atlanta, GA
| Zip Code | % Employed | vs State | vs National | |
| 1. | 30336 | 28.3% | 11.1%(+17.3)#14 | 10.9%(+17.5)#659 |
| 2. | 30332 | 24.2% | 11.1%(+13.2)#23 | 10.9%(+13.4)#996 |
| 3. | 30349 | 15.9% | 11.1%(+4.82)#90 | 10.9%(+5.04)#3,640 |
| 4. | 30350 | 14.9% | 11.1%(+3.79)#115 | 10.9%(+4.02)#4,737 |
| 5. | 30344 | 13.6% | 11.1%(+2.47)#170 | 10.9%(+2.70)#6,814 |
| 6. | 30311 | 13.2% | 11.1%(+2.16)#192 | 10.9%(+2.38)#7,494 |
| 7. | 30310 | 12.8% | 11.1%(+1.72)#217 | 10.9%(+1.94)#8,545 |
| 8. | 30331 | 12.7% | 11.1%(+1.62)#223 | 10.9%(+1.85)#8,790 |
| 9. | 30315 | 12.7% | 11.1%(+1.58)#225 | 10.9%(+1.80)#8,885 |
| 10. | 30314 | 12.1% | 11.1%(+1.04)#262 | 10.9%(+1.26)#10,388 |
| 11. | 30337 | 11.1% | 11.1%(+0.067)#342 | 10.9%(+0.291)#13,379 |
| 12. | 30303 | 11.1% | 11.1%(+0.018)#346 | 10.9%(+0.242)#13,542 |
| 13. | 30326 | 10.4% | 11.1%(-0.657)#393 | 10.9%(-0.434)#15,746 |
| 14. | 30346 | 10.0% | 11.1%(-1.06)#425 | 10.9%(-0.839)#17,069 |
| 15. | 30342 | 9.8% | 11.1%(-1.32)#442 | 10.9%(-1.10)#17,889 |
| 16. | 30318 | 9.6% | 11.1%(-1.50)#457 | 10.9%(-1.28)#18,488 |
| 17. | 30312 | 8.9% | 11.1%(-2.21)#493 | 10.9%(-1.99)#20,627 |
| 18. | 30339 | 8.7% | 11.1%(-2.37)#500 | 10.9%(-2.14)#21,115 |
| 19. | 30329 | 8.5% | 11.1%(-2.58)#518 | 10.9%(-2.36)#21,712 |
| 20. | 30354 | 8.3% | 11.1%(-2.78)#528 | 10.9%(-2.55)#22,211 |
| 21. | 30328 | 8.3% | 11.1%(-2.82)#534 | 10.9%(-2.60)#22,349 |
| 22. | 30340 | 8.1% | 11.1%(-2.98)#539 | 10.9%(-2.76)#22,787 |
| 23. | 30341 | 8.0% | 11.1%(-3.11)#547 | 10.9%(-2.88)#23,079 |
| 24. | 30313 | 8.0% | 11.1%(-3.11)#548 | 10.9%(-2.89)#23,095 |
| 25. | 30316 | 7.5% | 11.1%(-3.60)#568 | 10.9%(-3.37)#24,195 |
| 26. | 30308 | 7.4% | 11.1%(-3.64)#572 | 10.9%(-3.41)#24,308 |
| 27. | 30324 | 7.3% | 11.1%(-3.78)#576 | 10.9%(-3.56)#24,613 |
| 28. | 30305 | 7.2% | 11.1%(-3.87)#580 | 10.9%(-3.65)#24,806 |
| 29. | 30338 | 6.5% | 11.1%(-4.56)#610 | 10.9%(-4.34)#26,065 |
| 30. | 30360 | 6.3% | 11.1%(-4.79)#619 | 10.9%(-4.56)#26,424 |
| 31. | 30309 | 6.2% | 11.1%(-4.93)#621 | 10.9%(-4.70)#26,627 |
| 32. | 30345 | 5.9% | 11.1%(-5.16)#629 | 10.9%(-4.94)#26,960 |
| 33. | 30363 | 5.8% | 11.1%(-5.23)#632 | 10.9%(-5.01)#27,074 |
| 34. | 30327 | 5.5% | 11.1%(-5.60)#644 | 10.9%(-5.37)#27,567 |
| 35. | 30317 | 5.4% | 11.1%(-5.63)#645 | 10.9%(-5.41)#27,606 |
| 36. | 30319 | 5.1% | 11.1%(-6.00)#652 | 10.9%(-5.77)#28,022 |
| 37. | 30322 | 4.7% | 11.1%(-6.36)#657 | 10.9%(-6.13)#28,347 |
| 38. | 30307 | 4.3% | 11.1%(-6.73)#667 | 10.9%(-6.51)#28,707 |
| 39. | 30306 | 3.9% | 11.1%(-7.17)#675 | 10.9%(-6.95)#29,077 |
1
Common Questions
What are the Top 10 Zip Codes with the Highest Percentage of Population Employed in Office & Administration in Atlanta, GA?
Top 10 Zip Codes with the Highest Percentage of Population Employed in Office & Administration in Atlanta, GA are:
What zip code has the Highest Percentage of Population Employed in Office & Administration in Atlanta, GA?
30336 has the Highest Percentage of Population Employed in Office & Administration in Atlanta, GA with 28.3%.
What is the Percentage of Population Employed in Office & Administration in Atlanta, GA?
Percentage of Population Employed in Office & Administration in Atlanta is 8.5%.
What is the Percentage of Population Employed in Office & Administration in Georgia?
Percentage of Population Employed in Office & Administration in Georgia is 11.1%.
What is the Percentage of Population Employed in Office & Administration in the United States?
Percentage of Population Employed in Office & Administration in the United States is 10.9%.