Lebanese College, Under 1 year
COMPARE
Lebanese
Select to Compare
College, Under 1 year
Lebanese College, Under 1 year
67.5%
COLLEGE, UNDER 1 YEAR
94.6/ 100
METRIC RATING
119th/ 347
METRIC RANK
Lebanese College, Under 1 year Correlation Chart
The statistical analysis conducted on geographies consisting of 401,622,274 people shows a poor positive correlation between the proportion of Lebanese and percentage of population with at least college, under 1 year education in the United States with a correlation coefficient (R) of 0.120 and weighted average of 67.5%. On average, for every 1% (one percent) increase in Lebanese within a typical geography, there is an increase of 0.14% in percentage of population with at least college, under 1 year education.
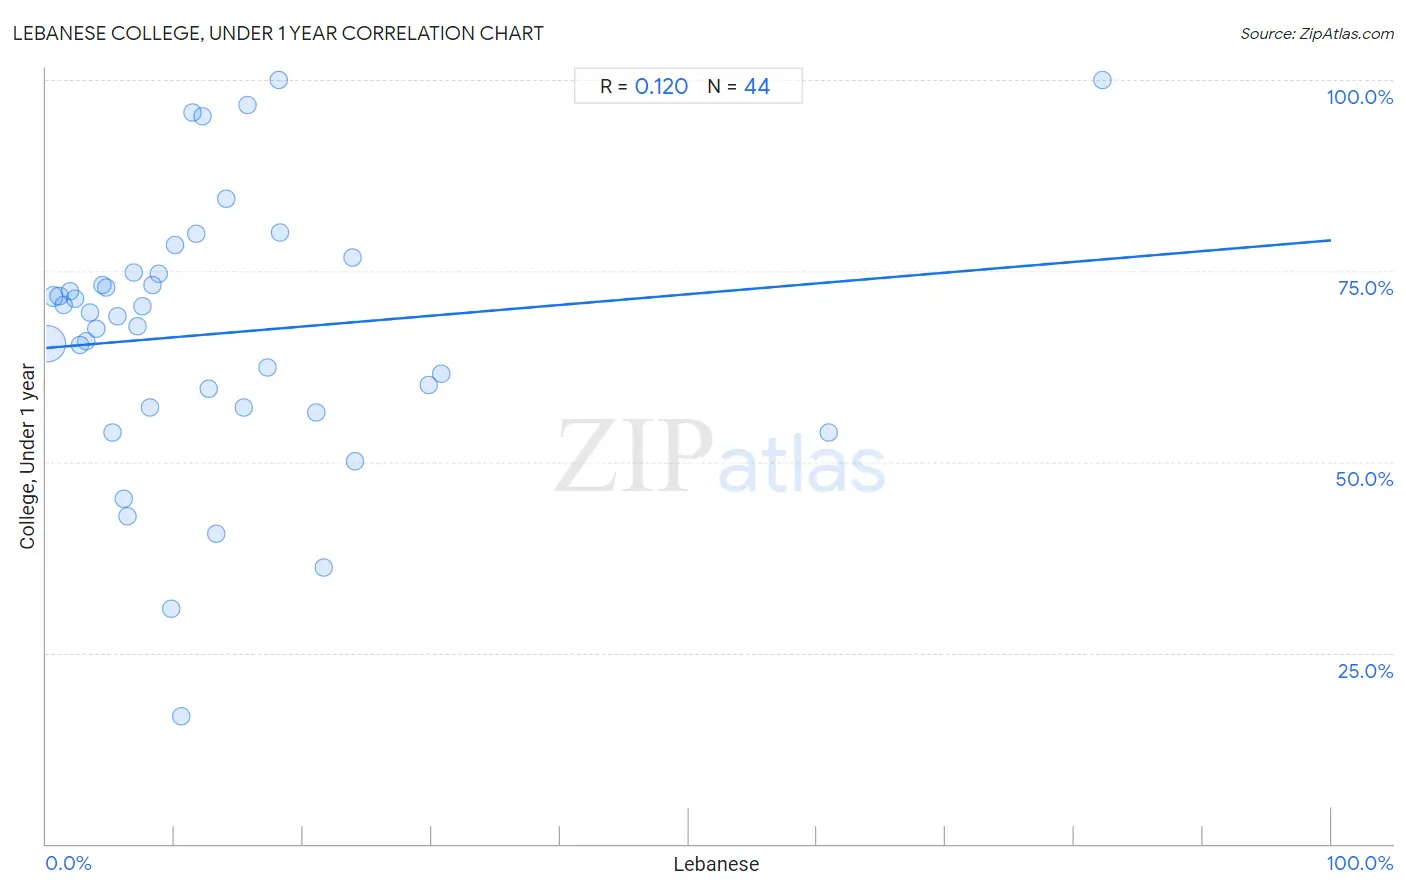
It is essential to understand that the correlation between the percentage of Lebanese and percentage of population with at least college, under 1 year education does not imply a direct cause-and-effect relationship. It remains uncertain whether the presence of Lebanese influences an upward or downward trend in the level of percentage of population with at least college, under 1 year education within an area, or if Lebanese simply ended up residing in those areas with higher or lower levels of percentage of population with at least college, under 1 year education due to other factors.
Demographics Similar to Lebanese by College, Under 1 year
In terms of college, under 1 year, the demographic groups most similar to Lebanese are Immigrants from Ukraine (67.5%, a difference of 0.010%), Pakistani (67.5%, a difference of 0.040%), Immigrants from Nepal (67.5%, a difference of 0.060%), Basque (67.6%, a difference of 0.14%), and Chilean (67.6%, a difference of 0.15%).
| Demographics | Rating | Rank | College, Under 1 year |
| Macedonians | 95.7 /100 | #112 | Exceptional 67.6% |
| Syrians | 95.6 /100 | #113 | Exceptional 67.6% |
| Chileans | 95.3 /100 | #114 | Exceptional 67.6% |
| Basques | 95.2 /100 | #115 | Exceptional 67.6% |
| Immigrants from Nepal | 94.9 /100 | #116 | Exceptional 67.5% |
| Pakistanis | 94.8 /100 | #117 | Exceptional 67.5% |
| Immigrants from Ukraine | 94.7 /100 | #118 | Exceptional 67.5% |
| Lebanese | 94.6 /100 | #119 | Exceptional 67.5% |
| Serbians | 93.9 /100 | #120 | Exceptional 67.4% |
| Slovenes | 93.3 /100 | #121 | Exceptional 67.3% |
| Immigrants from Jordan | 92.8 /100 | #122 | Exceptional 67.3% |
| Immigrants from Northern Africa | 92.7 /100 | #123 | Exceptional 67.2% |
| Arabs | 92.6 /100 | #124 | Exceptional 67.2% |
| Italians | 91.8 /100 | #125 | Exceptional 67.2% |
| Alsatians | 91.3 /100 | #126 | Exceptional 67.1% |
Lebanese College, Under 1 year Correlation Summary
| Measurement | Lebanese Data | College, Under 1 year Data |
| Minimum | 0.14% | 16.6% |
| Maximum | 82.2% | 100.0% |
| Range | 82.1% | 83.4% |
| Mean | 13.2% | 66.8% |
| Median | 9.2% | 69.3% |
| Interquartile 25% (IQ1) | 4.5% | 57.1% |
| Interquartile 75% (IQ3) | 16.4% | 74.7% |
| Interquartile Range (IQR) | 11.9% | 17.6% |
| Standard Deviation (Sample) | 15.2% | 17.8% |
| Standard Deviation (Population) | 15.0% | 17.6% |
Correlation Details
| Lebanese Percentile | Sample Size | College, Under 1 year |
[ 0.0% - 0.5% ] 0.14% | 348,646,752 | 65.5% |
[ 0.5% - 1.0% ] 0.55% | 37,693,751 | 71.7% |
[ 0.5% - 1.0% ] 0.99% | 8,848,027 | 71.7% |
[ 1.0% - 1.5% ] 1.39% | 3,371,654 | 70.6% |
[ 1.5% - 2.0% ] 1.83% | 1,219,750 | 72.3% |
[ 2.0% - 2.5% ] 2.21% | 622,669 | 71.3% |
[ 2.5% - 3.0% ] 2.60% | 425,130 | 65.2% |
[ 3.0% - 3.5% ] 3.10% | 160,186 | 65.8% |
[ 3.0% - 3.5% ] 3.42% | 83,909 | 69.5% |
[ 3.5% - 4.0% ] 3.90% | 132,801 | 67.4% |
[ 4.0% - 4.5% ] 4.35% | 14,447 | 73.2% |
[ 4.5% - 5.0% ] 4.70% | 19,352 | 72.8% |
[ 5.0% - 5.5% ] 5.16% | 31,752 | 53.8% |
[ 5.5% - 6.0% ] 5.51% | 11,382 | 69.1% |
[ 6.0% - 6.5% ] 6.00% | 916 | 45.2% |
[ 6.0% - 6.5% ] 6.34% | 1,231 | 43.0% |
[ 6.5% - 7.0% ] 6.78% | 8,720 | 74.8% |
[ 7.0% - 7.5% ] 7.08% | 7,982 | 67.8% |
[ 7.5% - 8.0% ] 7.52% | 1,277 | 70.3% |
[ 8.0% - 8.5% ] 8.11% | 37 | 57.1% |
[ 8.0% - 8.5% ] 8.31% | 34,676 | 73.2% |
[ 8.5% - 9.0% ] 8.76% | 639 | 74.7% |
[ 9.5% - 10.0% ] 9.72% | 1,039 | 30.7% |
[ 10.0% - 10.5% ] 10.02% | 479 | 78.4% |
[ 10.5% - 11.0% ] 10.53% | 361 | 16.6% |
[ 11.0% - 11.5% ] 11.40% | 772 | 95.7% |
[ 11.5% - 12.0% ] 11.67% | 180 | 79.9% |
[ 12.0% - 12.5% ] 12.12% | 726 | 95.3% |
[ 12.5% - 13.0% ] 12.67% | 2,359 | 59.5% |
[ 13.0% - 13.5% ] 13.22% | 469 | 40.6% |
[ 13.5% - 14.0% ] 13.97% | 229 | 84.4% |
[ 15.0% - 15.5% ] 15.38% | 156 | 57.1% |
[ 15.5% - 16.0% ] 15.63% | 531 | 96.8% |
[ 17.0% - 17.5% ] 17.21% | 108,588 | 62.3% |
[ 18.0% - 18.5% ] 18.09% | 94 | 100.0% |
[ 18.0% - 18.5% ] 18.18% | 66 | 80.0% |
[ 21.0% - 21.5% ] 21.06% | 62,474 | 56.5% |
[ 21.5% - 22.0% ] 21.57% | 51 | 36.2% |
[ 23.5% - 24.0% ] 23.82% | 12,405 | 76.8% |
[ 24.0% - 24.5% ] 24.07% | 53,044 | 50.1% |
[ 29.5% - 30.0% ] 29.74% | 40,392 | 60.1% |
[ 30.5% - 31.0% ] 30.77% | 52 | 61.5% |
[ 60.5% - 61.0% ] 60.91% | 660 | 53.9% |
[ 82.0% - 82.5% ] 82.24% | 107 | 100.0% |