Guamanian/Chamorro vs Ottawa College, Under 1 year
COMPARE
Guamanian/Chamorro
Ottawa
College, Under 1 year
College, Under 1 year Comparison
Guamanians/Chamorros
Ottawa
65.4%
COLLEGE, UNDER 1 YEAR
48.2/ 100
METRIC RATING
179th/ 347
METRIC RANK
62.2%
COLLEGE, UNDER 1 YEAR
1.1/ 100
METRIC RATING
241st/ 347
METRIC RANK
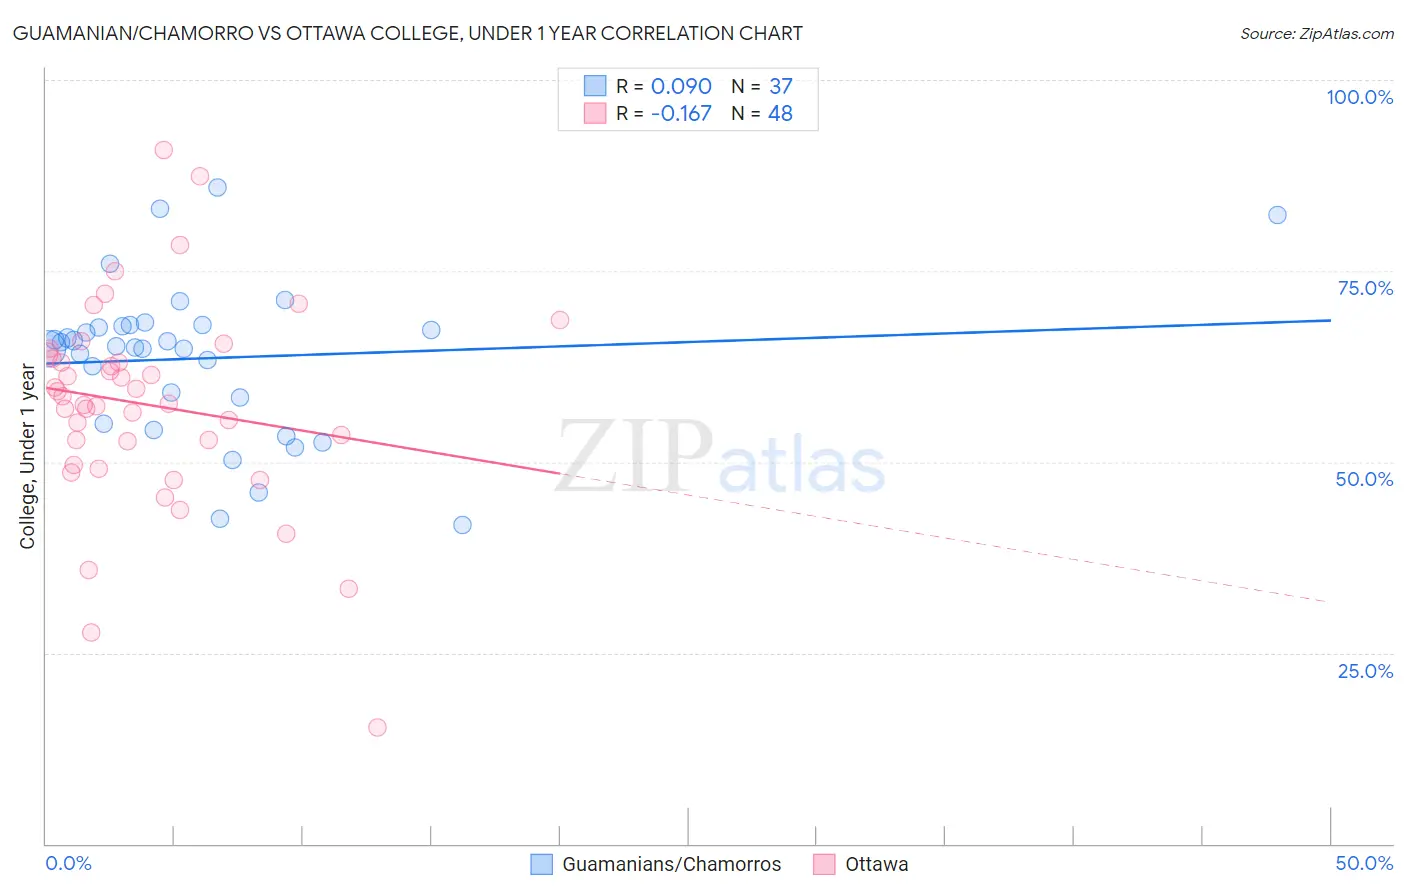
Guamanian/Chamorro vs Ottawa College, Under 1 year Correlation Chart
The statistical analysis conducted on geographies consisting of 221,965,438 people shows a slight positive correlation between the proportion of Guamanians/Chamorros and percentage of population with at least college, under 1 year education in the United States with a correlation coefficient (R) of 0.090 and weighted average of 65.4%. Similarly, the statistical analysis conducted on geographies consisting of 49,956,726 people shows a poor negative correlation between the proportion of Ottawa and percentage of population with at least college, under 1 year education in the United States with a correlation coefficient (R) of -0.167 and weighted average of 62.2%, a difference of 5.1%.
College, Under 1 year Correlation Summary
| Measurement | Guamanian/Chamorro | Ottawa |
| Minimum | 41.7% | 15.3% |
| Maximum | 85.9% | 90.8% |
| Range | 44.2% | 75.6% |
| Mean | 63.6% | 57.5% |
| Median | 65.1% | 58.1% |
| Interquartile 25% (IQ1) | 56.8% | 51.2% |
| Interquartile 75% (IQ3) | 67.9% | 63.8% |
| Interquartile Range (IQR) | 11.1% | 12.6% |
| Standard Deviation (Sample) | 10.0% | 13.6% |
| Standard Deviation (Population) | 9.9% | 13.5% |
Similar Demographics by College, Under 1 year
Demographics Similar to Guamanians/Chamorros by College, Under 1 year
In terms of college, under 1 year, the demographic groups most similar to Guamanians/Chamorros are German Russian (65.4%, a difference of 0.0%), Immigrants from North Macedonia (65.4%, a difference of 0.020%), French (65.4%, a difference of 0.030%), Scotch-Irish (65.4%, a difference of 0.060%), and Immigrants from Bosnia and Herzegovina (65.4%, a difference of 0.080%).
| Demographics | Rating | Rank | College, Under 1 year |
| South American Indians | 54.4 /100 | #172 | Average 65.5% |
| Swiss | 53.9 /100 | #173 | Average 65.5% |
| Immigrants | Bosnia and Herzegovina | 50.0 /100 | #174 | Average 65.4% |
| Scotch-Irish | 49.5 /100 | #175 | Average 65.4% |
| French | 48.9 /100 | #176 | Average 65.4% |
| Immigrants | North Macedonia | 48.6 /100 | #177 | Average 65.4% |
| German Russians | 48.3 /100 | #178 | Average 65.4% |
| Guamanians/Chamorros | 48.2 /100 | #179 | Average 65.4% |
| Dutch | 46.1 /100 | #180 | Average 65.3% |
| Spaniards | 45.5 /100 | #181 | Average 65.3% |
| Immigrants | Africa | 44.7 /100 | #182 | Average 65.3% |
| Immigrants | Poland | 42.6 /100 | #183 | Average 65.2% |
| Bermudans | 42.0 /100 | #184 | Average 65.2% |
| Sri Lankans | 41.7 /100 | #185 | Average 65.2% |
| Immigrants | Sierra Leone | 39.7 /100 | #186 | Fair 65.1% |
Demographics Similar to Ottawa by College, Under 1 year
In terms of college, under 1 year, the demographic groups most similar to Ottawa are Nepalese (62.2%, a difference of 0.010%), Aleut (62.2%, a difference of 0.010%), Malaysian (62.2%, a difference of 0.050%), Hawaiian (62.1%, a difference of 0.080%), and Colville (62.1%, a difference of 0.17%).
| Demographics | Rating | Rank | College, Under 1 year |
| Chippewa | 2.0 /100 | #234 | Tragic 62.6% |
| Spanish Americans | 1.9 /100 | #235 | Tragic 62.6% |
| Immigrants | Immigrants | 1.7 /100 | #236 | Tragic 62.5% |
| Immigrants | Burma/Myanmar | 1.6 /100 | #237 | Tragic 62.5% |
| French American Indians | 1.5 /100 | #238 | Tragic 62.4% |
| Nepalese | 1.1 /100 | #239 | Tragic 62.2% |
| Aleuts | 1.1 /100 | #240 | Tragic 62.2% |
| Ottawa | 1.1 /100 | #241 | Tragic 62.2% |
| Malaysians | 1.1 /100 | #242 | Tragic 62.2% |
| Hawaiians | 1.1 /100 | #243 | Tragic 62.1% |
| Colville | 1.0 /100 | #244 | Tragic 62.1% |
| Delaware | 0.9 /100 | #245 | Tragic 62.1% |
| Marshallese | 0.8 /100 | #246 | Tragic 61.9% |
| Immigrants | Liberia | 0.8 /100 | #247 | Tragic 61.9% |
| Potawatomi | 0.6 /100 | #248 | Tragic 61.8% |