Guamanian/Chamorro vs Slavic College, Under 1 year
COMPARE
Guamanian/Chamorro
Slavic
College, Under 1 year
College, Under 1 year Comparison
Guamanians/Chamorros
Slavs
65.4%
COLLEGE, UNDER 1 YEAR
48.2/ 100
METRIC RATING
179th/ 347
METRIC RANK
66.7%
COLLEGE, UNDER 1 YEAR
85.9/ 100
METRIC RATING
140th/ 347
METRIC RANK
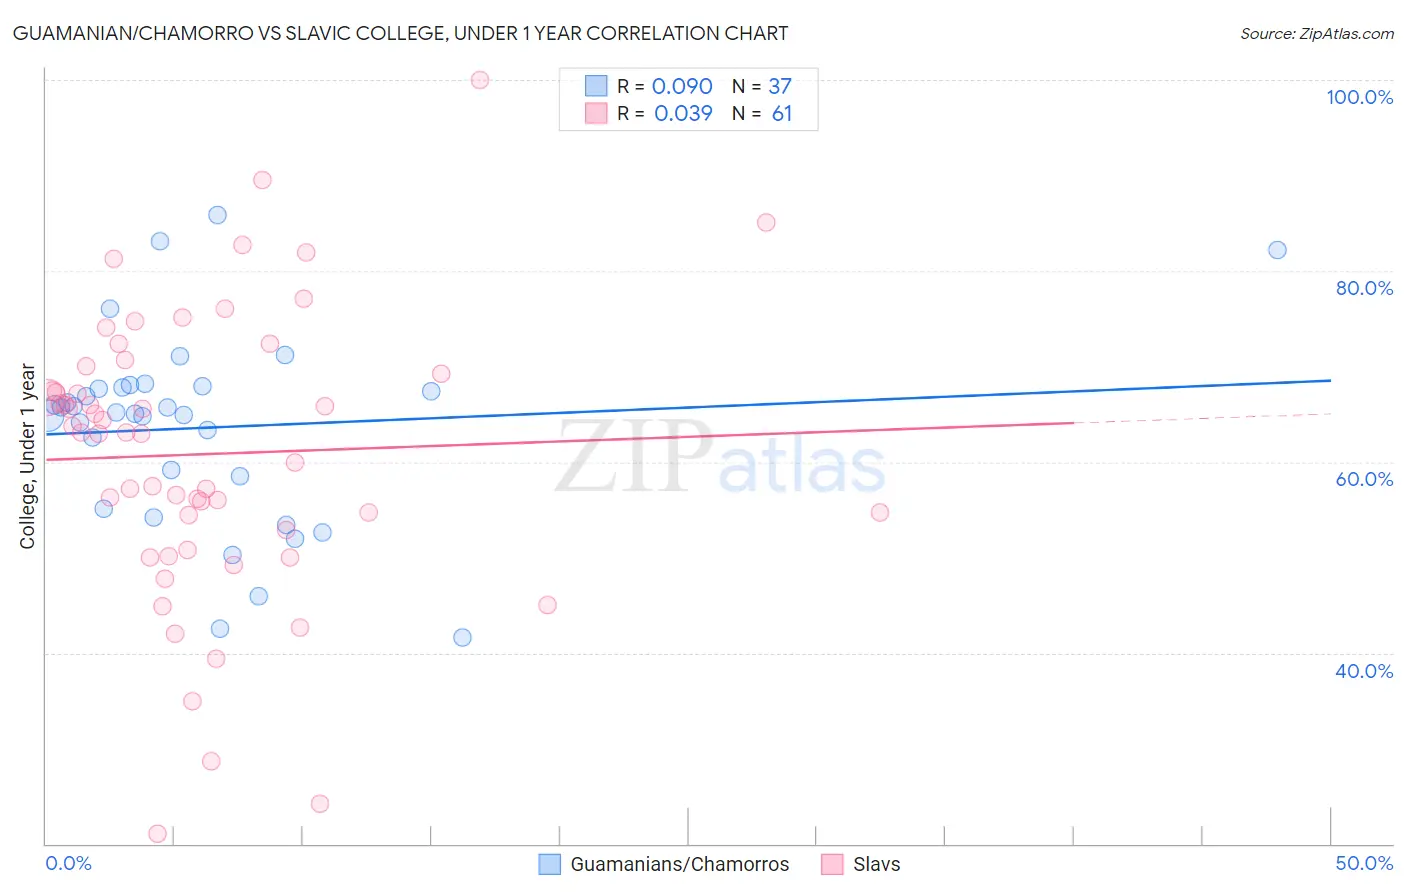
Guamanian/Chamorro vs Slavic College, Under 1 year Correlation Chart
The statistical analysis conducted on geographies consisting of 221,965,438 people shows a slight positive correlation between the proportion of Guamanians/Chamorros and percentage of population with at least college, under 1 year education in the United States with a correlation coefficient (R) of 0.090 and weighted average of 65.4%. Similarly, the statistical analysis conducted on geographies consisting of 270,867,455 people shows no correlation between the proportion of Slavs and percentage of population with at least college, under 1 year education in the United States with a correlation coefficient (R) of 0.039 and weighted average of 66.7%, a difference of 2.1%.
College, Under 1 year Correlation Summary
| Measurement | Guamanian/Chamorro | Slavic |
| Minimum | 41.7% | 21.0% |
| Maximum | 85.9% | 100.0% |
| Range | 44.2% | 79.0% |
| Mean | 63.6% | 60.8% |
| Median | 65.1% | 63.0% |
| Interquartile 25% (IQ1) | 56.8% | 51.8% |
| Interquartile 75% (IQ3) | 67.9% | 69.7% |
| Interquartile Range (IQR) | 11.1% | 17.9% |
| Standard Deviation (Sample) | 10.0% | 15.1% |
| Standard Deviation (Population) | 9.9% | 14.9% |
Similar Demographics by College, Under 1 year
Demographics Similar to Guamanians/Chamorros by College, Under 1 year
In terms of college, under 1 year, the demographic groups most similar to Guamanians/Chamorros are German Russian (65.4%, a difference of 0.0%), Immigrants from North Macedonia (65.4%, a difference of 0.020%), French (65.4%, a difference of 0.030%), Scotch-Irish (65.4%, a difference of 0.060%), and Immigrants from Bosnia and Herzegovina (65.4%, a difference of 0.080%).
| Demographics | Rating | Rank | College, Under 1 year |
| South American Indians | 54.4 /100 | #172 | Average 65.5% |
| Swiss | 53.9 /100 | #173 | Average 65.5% |
| Immigrants | Bosnia and Herzegovina | 50.0 /100 | #174 | Average 65.4% |
| Scotch-Irish | 49.5 /100 | #175 | Average 65.4% |
| French | 48.9 /100 | #176 | Average 65.4% |
| Immigrants | North Macedonia | 48.6 /100 | #177 | Average 65.4% |
| German Russians | 48.3 /100 | #178 | Average 65.4% |
| Guamanians/Chamorros | 48.2 /100 | #179 | Average 65.4% |
| Dutch | 46.1 /100 | #180 | Average 65.3% |
| Spaniards | 45.5 /100 | #181 | Average 65.3% |
| Immigrants | Africa | 44.7 /100 | #182 | Average 65.3% |
| Immigrants | Poland | 42.6 /100 | #183 | Average 65.2% |
| Bermudans | 42.0 /100 | #184 | Average 65.2% |
| Sri Lankans | 41.7 /100 | #185 | Average 65.2% |
| Immigrants | Sierra Leone | 39.7 /100 | #186 | Fair 65.1% |
Demographics Similar to Slavs by College, Under 1 year
In terms of college, under 1 year, the demographic groups most similar to Slavs are Venezuelan (66.7%, a difference of 0.0%), Immigrants from Afghanistan (66.7%, a difference of 0.070%), Immigrants from Italy (66.8%, a difference of 0.10%), Immigrants from Chile (66.8%, a difference of 0.15%), and Ugandan (66.8%, a difference of 0.18%).
| Demographics | Rating | Rank | College, Under 1 year |
| Immigrants | Brazil | 88.3 /100 | #133 | Excellent 66.9% |
| Iraqis | 88.0 /100 | #134 | Excellent 66.8% |
| Canadians | 87.9 /100 | #135 | Excellent 66.8% |
| Ugandans | 87.8 /100 | #136 | Excellent 66.8% |
| Immigrants | Chile | 87.4 /100 | #137 | Excellent 66.8% |
| Immigrants | Italy | 86.9 /100 | #138 | Excellent 66.8% |
| Venezuelans | 85.9 /100 | #139 | Excellent 66.7% |
| Slavs | 85.9 /100 | #140 | Excellent 66.7% |
| Immigrants | Afghanistan | 85.1 /100 | #141 | Excellent 66.7% |
| English | 82.9 /100 | #142 | Excellent 66.6% |
| Immigrants | Uganda | 82.8 /100 | #143 | Excellent 66.5% |
| Immigrants | Germany | 82.0 /100 | #144 | Excellent 66.5% |
| Immigrants | Kenya | 81.8 /100 | #145 | Excellent 66.5% |
| Kenyans | 81.7 /100 | #146 | Excellent 66.5% |
| Immigrants | Morocco | 81.7 /100 | #147 | Excellent 66.5% |