Thai vs Paiute Disability Age Under 5
COMPARE
Thai
Paiute
Disability Age Under 5
Disability Age Under 5 Comparison
Thais
Paiute
1.1%
DISABILITY AGE UNDER 5
99.8/ 100
METRIC RATING
41st/ 347
METRIC RANK
3.9%
DISABILITY AGE UNDER 5
0.0/ 100
METRIC RATING
345th/ 347
METRIC RANK
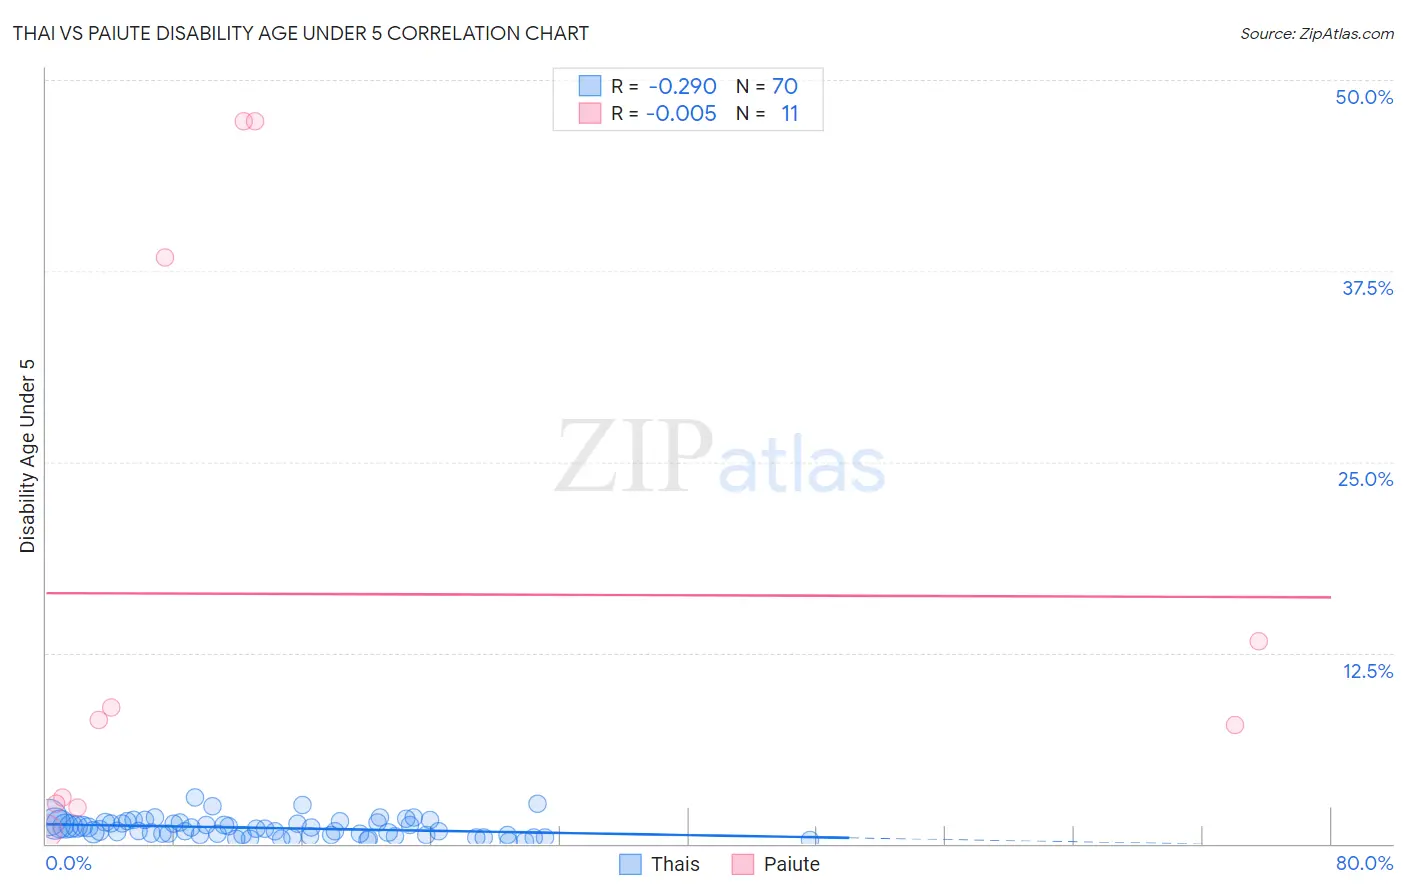
Thai vs Paiute Disability Age Under 5 Correlation Chart
The statistical analysis conducted on geographies consisting of 242,704,166 people shows a weak negative correlation between the proportion of Thais and percentage of population with a disability under the age of 5 in the United States with a correlation coefficient (R) of -0.290 and weighted average of 1.1%. Similarly, the statistical analysis conducted on geographies consisting of 49,758,622 people shows no correlation between the proportion of Paiute and percentage of population with a disability under the age of 5 in the United States with a correlation coefficient (R) of -0.005 and weighted average of 3.9%, a difference of 268.7%.
Disability Age Under 5 Correlation Summary
| Measurement | Thai | Paiute |
| Minimum | 0.14% | 0.83% |
| Maximum | 3.0% | 47.3% |
| Range | 2.9% | 46.5% |
| Mean | 1.0% | 16.3% |
| Median | 1.0% | 8.1% |
| Interquartile 25% (IQ1) | 0.58% | 2.6% |
| Interquartile 75% (IQ3) | 1.3% | 38.4% |
| Interquartile Range (IQR) | 0.76% | 35.7% |
| Standard Deviation (Sample) | 0.60% | 18.5% |
| Standard Deviation (Population) | 0.60% | 17.6% |
Similar Demographics by Disability Age Under 5
Demographics Similar to Thais by Disability Age Under 5
In terms of disability age under 5, the demographic groups most similar to Thais are Immigrants from Bulgaria (1.1%, a difference of 0.10%), Pima (1.1%, a difference of 0.11%), Immigrants from Asia (1.1%, a difference of 0.21%), Immigrants from Albania (1.1%, a difference of 0.41%), and Immigrants from Turkey (1.1%, a difference of 0.43%).
| Demographics | Rating | Rank | Disability Age Under 5 |
| Immigrants | Ukraine | 99.9 /100 | #34 | Exceptional 1.0% |
| Barbadians | 99.9 /100 | #35 | Exceptional 1.0% |
| Immigrants | Nepal | 99.9 /100 | #36 | Exceptional 1.0% |
| Immigrants | India | 99.9 /100 | #37 | Exceptional 1.0% |
| Immigrants | Guyana | 99.9 /100 | #38 | Exceptional 1.0% |
| Filipinos | 99.9 /100 | #39 | Exceptional 1.1% |
| Immigrants | Albania | 99.9 /100 | #40 | Exceptional 1.1% |
| Thais | 99.8 /100 | #41 | Exceptional 1.1% |
| Immigrants | Bulgaria | 99.8 /100 | #42 | Exceptional 1.1% |
| Pima | 99.8 /100 | #43 | Exceptional 1.1% |
| Immigrants | Asia | 99.8 /100 | #44 | Exceptional 1.1% |
| Immigrants | Turkey | 99.8 /100 | #45 | Exceptional 1.1% |
| Immigrants | Congo | 99.8 /100 | #46 | Exceptional 1.1% |
| Immigrants | Sweden | 99.8 /100 | #47 | Exceptional 1.1% |
| Immigrants | Singapore | 99.7 /100 | #48 | Exceptional 1.1% |
Demographics Similar to Paiute by Disability Age Under 5
In terms of disability age under 5, the demographic groups most similar to Paiute are Inupiat (3.7%, a difference of 5.3%), Yup'ik (4.5%, a difference of 15.8%), Hopi (4.6%, a difference of 18.4%), Colville (3.3%, a difference of 19.0%), and Alaska Native (2.9%, a difference of 32.9%).
| Demographics | Rating | Rank | Disability Age Under 5 |
| Dutch West Indians | 0.0 /100 | #333 | Tragic 1.9% |
| Natives/Alaskans | 0.0 /100 | #334 | Tragic 1.9% |
| Pennsylvania Germans | 0.0 /100 | #335 | Tragic 1.9% |
| Paraguayans | 0.0 /100 | #336 | Tragic 2.0% |
| Apache | 0.0 /100 | #337 | Tragic 2.0% |
| Tohono O'odham | 0.0 /100 | #338 | Tragic 2.2% |
| Immigrants | Azores | 0.0 /100 | #339 | Tragic 2.2% |
| Menominee | 0.0 /100 | #340 | Tragic 2.3% |
| Tsimshian | 0.0 /100 | #341 | Tragic 2.4% |
| Alaska Natives | 0.0 /100 | #342 | Tragic 2.9% |
| Colville | 0.0 /100 | #343 | Tragic 3.3% |
| Inupiat | 0.0 /100 | #344 | Tragic 3.7% |
| Paiute | 0.0 /100 | #345 | Tragic 3.9% |
| Yup'ik | 0.0 /100 | #346 | Tragic 4.5% |
| Hopi | 0.0 /100 | #347 | Tragic 4.6% |