Thai vs Russian Disability Age Under 5
COMPARE
Thai
Russian
Disability Age Under 5
Disability Age Under 5 Comparison
Thais
Russians
1.1%
DISABILITY AGE UNDER 5
99.8/ 100
METRIC RATING
41st/ 347
METRIC RANK
1.4%
DISABILITY AGE UNDER 5
1.0/ 100
METRIC RATING
246th/ 347
METRIC RANK
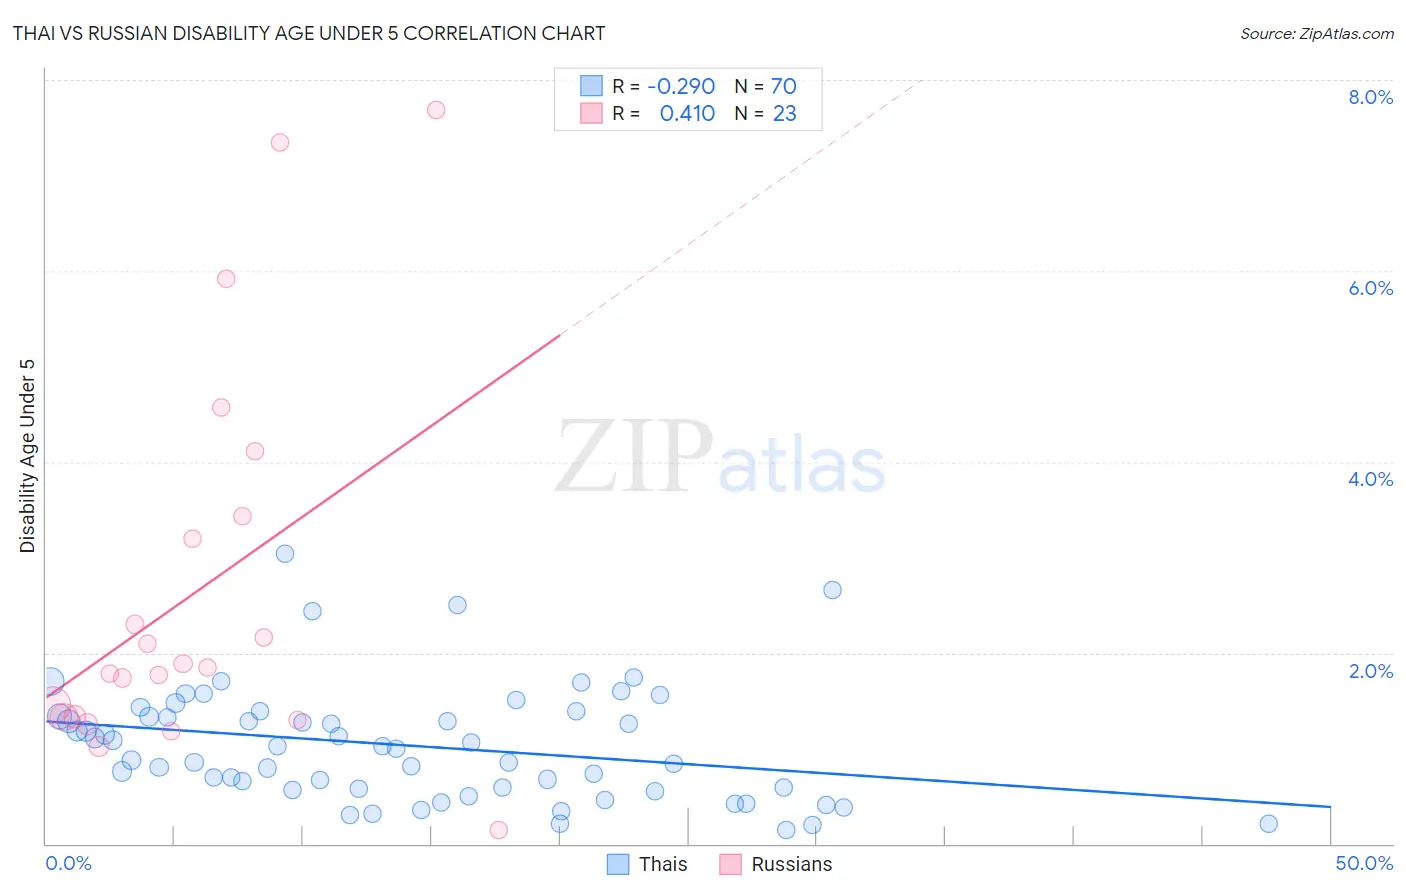
Thai vs Russian Disability Age Under 5 Correlation Chart
The statistical analysis conducted on geographies consisting of 242,704,166 people shows a weak negative correlation between the proportion of Thais and percentage of population with a disability under the age of 5 in the United States with a correlation coefficient (R) of -0.290 and weighted average of 1.1%. Similarly, the statistical analysis conducted on geographies consisting of 247,754,409 people shows a moderate positive correlation between the proportion of Russians and percentage of population with a disability under the age of 5 in the United States with a correlation coefficient (R) of 0.410 and weighted average of 1.4%, a difference of 29.0%.
Disability Age Under 5 Correlation Summary
| Measurement | Thai | Russian |
| Minimum | 0.14% | 0.14% |
| Maximum | 3.0% | 7.7% |
| Range | 2.9% | 7.6% |
| Mean | 1.0% | 2.6% |
| Median | 1.0% | 1.8% |
| Interquartile 25% (IQ1) | 0.58% | 1.3% |
| Interquartile 75% (IQ3) | 1.3% | 3.4% |
| Interquartile Range (IQR) | 0.76% | 2.1% |
| Standard Deviation (Sample) | 0.60% | 2.0% |
| Standard Deviation (Population) | 0.60% | 2.0% |
Similar Demographics by Disability Age Under 5
Demographics Similar to Thais by Disability Age Under 5
In terms of disability age under 5, the demographic groups most similar to Thais are Immigrants from Bulgaria (1.1%, a difference of 0.10%), Pima (1.1%, a difference of 0.11%), Immigrants from Asia (1.1%, a difference of 0.21%), Immigrants from Albania (1.1%, a difference of 0.41%), and Immigrants from Turkey (1.1%, a difference of 0.43%).
| Demographics | Rating | Rank | Disability Age Under 5 |
| Immigrants | Ukraine | 99.9 /100 | #34 | Exceptional 1.0% |
| Barbadians | 99.9 /100 | #35 | Exceptional 1.0% |
| Immigrants | Nepal | 99.9 /100 | #36 | Exceptional 1.0% |
| Immigrants | India | 99.9 /100 | #37 | Exceptional 1.0% |
| Immigrants | Guyana | 99.9 /100 | #38 | Exceptional 1.0% |
| Filipinos | 99.9 /100 | #39 | Exceptional 1.1% |
| Immigrants | Albania | 99.9 /100 | #40 | Exceptional 1.1% |
| Thais | 99.8 /100 | #41 | Exceptional 1.1% |
| Immigrants | Bulgaria | 99.8 /100 | #42 | Exceptional 1.1% |
| Pima | 99.8 /100 | #43 | Exceptional 1.1% |
| Immigrants | Asia | 99.8 /100 | #44 | Exceptional 1.1% |
| Immigrants | Turkey | 99.8 /100 | #45 | Exceptional 1.1% |
| Immigrants | Congo | 99.8 /100 | #46 | Exceptional 1.1% |
| Immigrants | Sweden | 99.8 /100 | #47 | Exceptional 1.1% |
| Immigrants | Singapore | 99.7 /100 | #48 | Exceptional 1.1% |
Demographics Similar to Russians by Disability Age Under 5
In terms of disability age under 5, the demographic groups most similar to Russians are Immigrants from England (1.4%, a difference of 0.010%), Eastern European (1.4%, a difference of 0.050%), Potawatomi (1.4%, a difference of 0.13%), Bermudan (1.4%, a difference of 0.13%), and African (1.4%, a difference of 0.14%).
| Demographics | Rating | Rank | Disability Age Under 5 |
| Immigrants | Austria | 2.3 /100 | #239 | Tragic 1.3% |
| Native Hawaiians | 2.2 /100 | #240 | Tragic 1.3% |
| Maltese | 2.2 /100 | #241 | Tragic 1.3% |
| Lumbee | 2.1 /100 | #242 | Tragic 1.3% |
| Immigrants | Cameroon | 1.7 /100 | #243 | Tragic 1.4% |
| Spaniards | 1.4 /100 | #244 | Tragic 1.4% |
| Potawatomi | 1.1 /100 | #245 | Tragic 1.4% |
| Russians | 1.0 /100 | #246 | Tragic 1.4% |
| Immigrants | England | 1.0 /100 | #247 | Tragic 1.4% |
| Eastern Europeans | 1.0 /100 | #248 | Tragic 1.4% |
| Bermudans | 1.0 /100 | #249 | Tragic 1.4% |
| Africans | 1.0 /100 | #250 | Tragic 1.4% |
| Immigrants | Hungary | 1.0 /100 | #251 | Tragic 1.4% |
| Immigrants | Scotland | 0.9 /100 | #252 | Tragic 1.4% |
| Australians | 0.7 /100 | #253 | Tragic 1.4% |