Thai vs Immigrants from Northern Africa Disability Age Under 5
COMPARE
Thai
Immigrants from Northern Africa
Disability Age Under 5
Disability Age Under 5 Comparison
Thais
Immigrants from Northern Africa
1.1%
DISABILITY AGE UNDER 5
99.8/ 100
METRIC RATING
41st/ 347
METRIC RANK
1.2%
DISABILITY AGE UNDER 5
93.8/ 100
METRIC RATING
116th/ 347
METRIC RANK
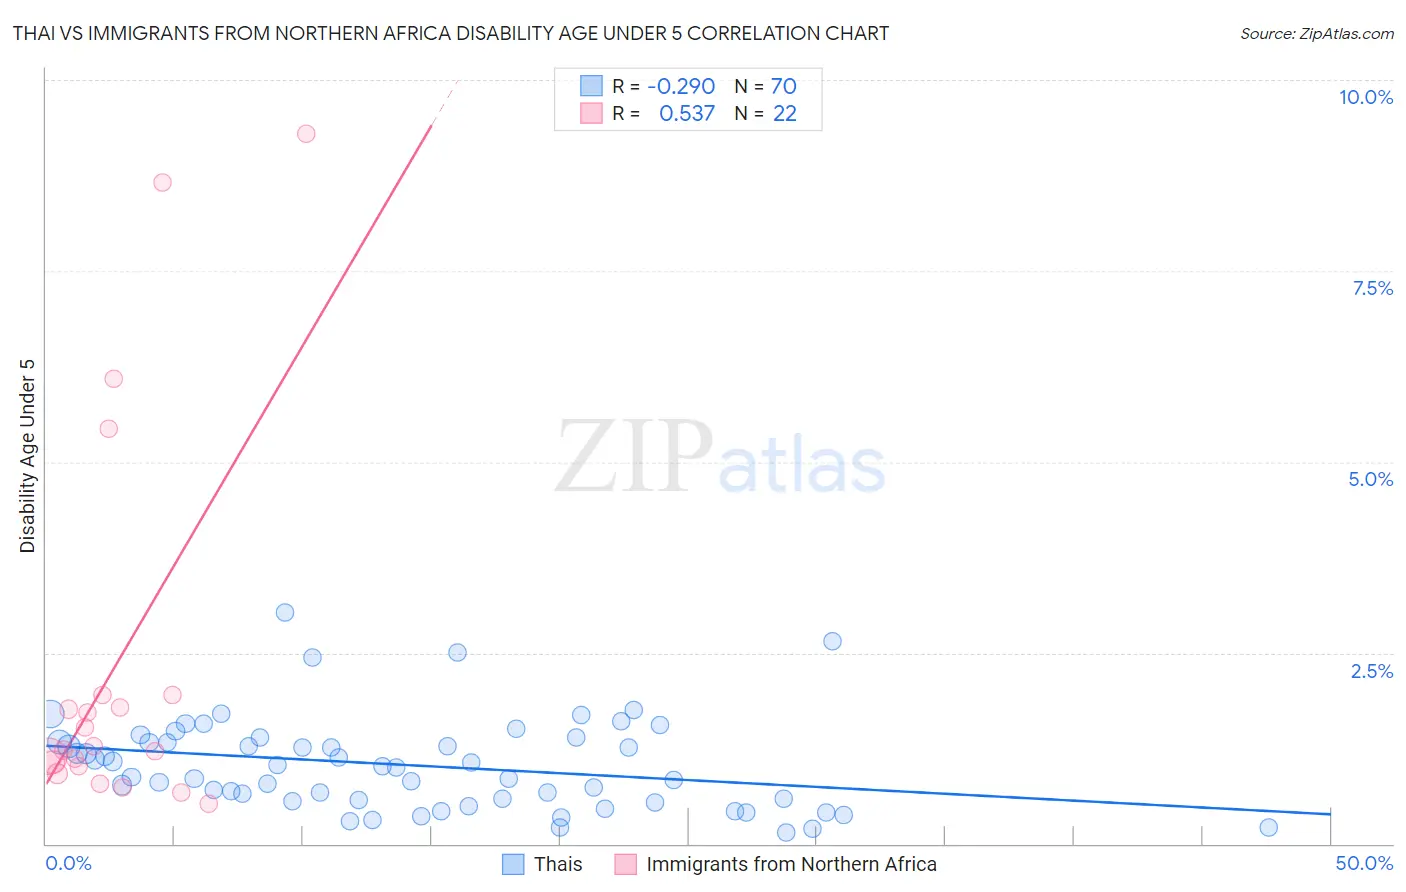
Thai vs Immigrants from Northern Africa Disability Age Under 5 Correlation Chart
The statistical analysis conducted on geographies consisting of 242,704,166 people shows a weak negative correlation between the proportion of Thais and percentage of population with a disability under the age of 5 in the United States with a correlation coefficient (R) of -0.290 and weighted average of 1.1%. Similarly, the statistical analysis conducted on geographies consisting of 185,664,866 people shows a substantial positive correlation between the proportion of Immigrants from Northern Africa and percentage of population with a disability under the age of 5 in the United States with a correlation coefficient (R) of 0.537 and weighted average of 1.2%, a difference of 9.8%.
Disability Age Under 5 Correlation Summary
| Measurement | Thai | Immigrants from Northern Africa |
| Minimum | 0.14% | 0.53% |
| Maximum | 3.0% | 9.3% |
| Range | 2.9% | 8.8% |
| Mean | 1.0% | 2.4% |
| Median | 1.0% | 1.3% |
| Interquartile 25% (IQ1) | 0.58% | 1.0% |
| Interquartile 75% (IQ3) | 1.3% | 1.9% |
| Interquartile Range (IQR) | 0.76% | 0.93% |
| Standard Deviation (Sample) | 0.60% | 2.6% |
| Standard Deviation (Population) | 0.60% | 2.5% |
Similar Demographics by Disability Age Under 5
Demographics Similar to Thais by Disability Age Under 5
In terms of disability age under 5, the demographic groups most similar to Thais are Immigrants from Bulgaria (1.1%, a difference of 0.10%), Pima (1.1%, a difference of 0.11%), Immigrants from Asia (1.1%, a difference of 0.21%), Immigrants from Albania (1.1%, a difference of 0.41%), and Immigrants from Turkey (1.1%, a difference of 0.43%).
| Demographics | Rating | Rank | Disability Age Under 5 |
| Immigrants | Ukraine | 99.9 /100 | #34 | Exceptional 1.0% |
| Barbadians | 99.9 /100 | #35 | Exceptional 1.0% |
| Immigrants | Nepal | 99.9 /100 | #36 | Exceptional 1.0% |
| Immigrants | India | 99.9 /100 | #37 | Exceptional 1.0% |
| Immigrants | Guyana | 99.9 /100 | #38 | Exceptional 1.0% |
| Filipinos | 99.9 /100 | #39 | Exceptional 1.1% |
| Immigrants | Albania | 99.9 /100 | #40 | Exceptional 1.1% |
| Thais | 99.8 /100 | #41 | Exceptional 1.1% |
| Immigrants | Bulgaria | 99.8 /100 | #42 | Exceptional 1.1% |
| Pima | 99.8 /100 | #43 | Exceptional 1.1% |
| Immigrants | Asia | 99.8 /100 | #44 | Exceptional 1.1% |
| Immigrants | Turkey | 99.8 /100 | #45 | Exceptional 1.1% |
| Immigrants | Congo | 99.8 /100 | #46 | Exceptional 1.1% |
| Immigrants | Sweden | 99.8 /100 | #47 | Exceptional 1.1% |
| Immigrants | Singapore | 99.7 /100 | #48 | Exceptional 1.1% |
Demographics Similar to Immigrants from Northern Africa by Disability Age Under 5
In terms of disability age under 5, the demographic groups most similar to Immigrants from Northern Africa are Immigrants from Caribbean (1.2%, a difference of 0.020%), Belizean (1.2%, a difference of 0.030%), Immigrants from Philippines (1.2%, a difference of 0.13%), Immigrants from Venezuela (1.2%, a difference of 0.17%), and Immigrants from Oceania (1.2%, a difference of 0.18%).
| Demographics | Rating | Rank | Disability Age Under 5 |
| Immigrants | Panama | 95.0 /100 | #109 | Exceptional 1.2% |
| Immigrants | Lebanon | 95.0 /100 | #110 | Exceptional 1.2% |
| Senegalese | 94.6 /100 | #111 | Exceptional 1.2% |
| Immigrants | Australia | 94.4 /100 | #112 | Exceptional 1.2% |
| Immigrants | Oceania | 94.2 /100 | #113 | Exceptional 1.2% |
| Belizeans | 93.9 /100 | #114 | Exceptional 1.2% |
| Immigrants | Caribbean | 93.8 /100 | #115 | Exceptional 1.2% |
| Immigrants | Northern Africa | 93.8 /100 | #116 | Exceptional 1.2% |
| Immigrants | Philippines | 93.5 /100 | #117 | Exceptional 1.2% |
| Immigrants | Venezuela | 93.4 /100 | #118 | Exceptional 1.2% |
| Bhutanese | 92.5 /100 | #119 | Exceptional 1.2% |
| Immigrants | Eritrea | 92.3 /100 | #120 | Exceptional 1.2% |
| Immigrants | Senegal | 91.4 /100 | #121 | Exceptional 1.2% |
| Aleuts | 90.7 /100 | #122 | Exceptional 1.2% |
| Zimbabweans | 90.6 /100 | #123 | Exceptional 1.2% |