Pennsylvania German vs Lumbee Disability Age Under 5
COMPARE
Pennsylvania German
Lumbee
Disability Age Under 5
Disability Age Under 5 Comparison
Pennsylvania Germans
Lumbee
1.9%
DISABILITY AGE UNDER 5
0.0/ 100
METRIC RATING
335th/ 347
METRIC RANK
1.3%
DISABILITY AGE UNDER 5
2.1/ 100
METRIC RATING
242nd/ 347
METRIC RANK
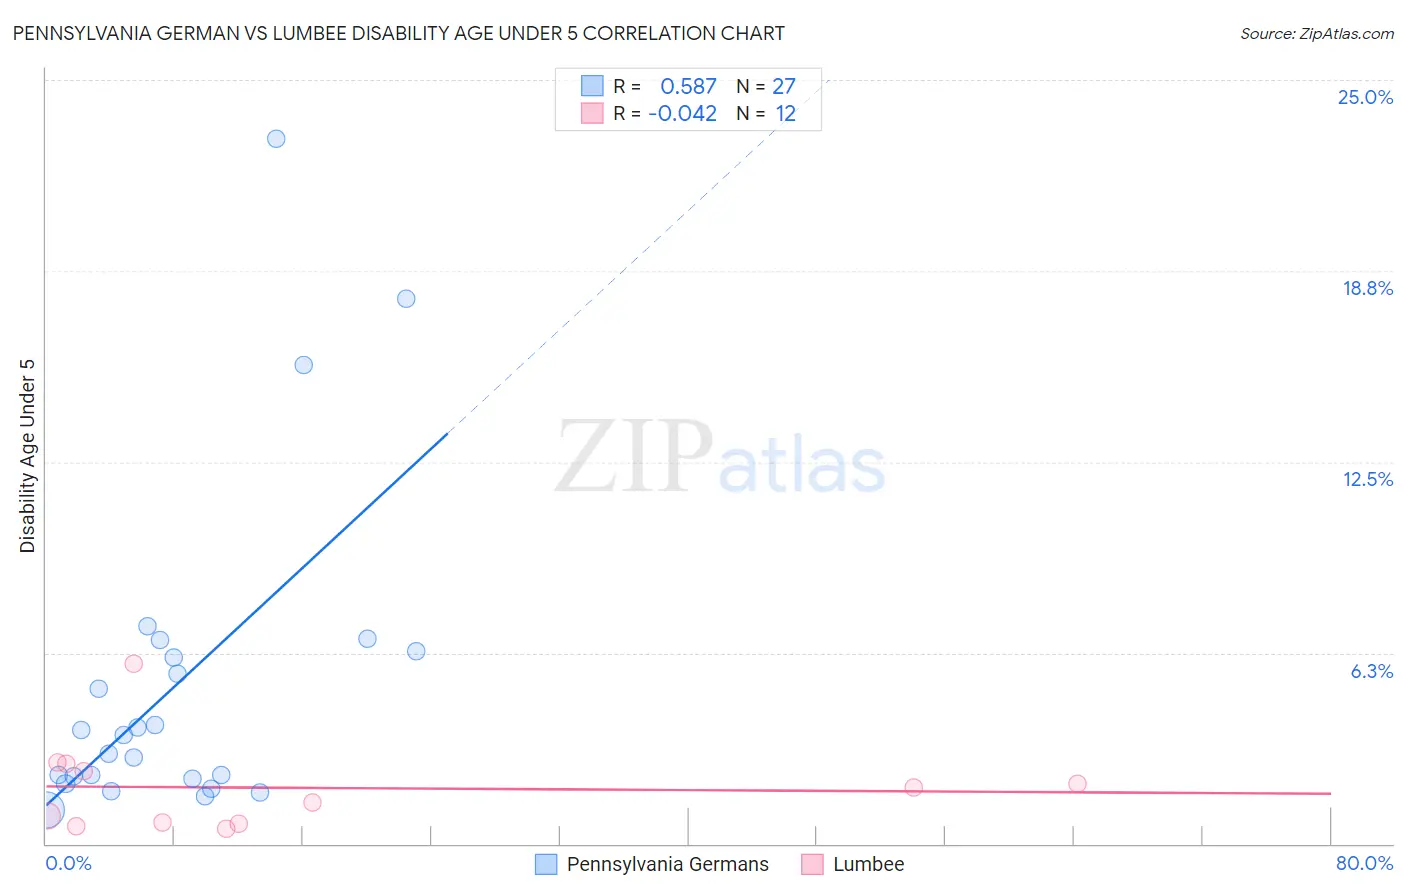
Pennsylvania German vs Lumbee Disability Age Under 5 Correlation Chart
The statistical analysis conducted on geographies consisting of 141,367,234 people shows a substantial positive correlation between the proportion of Pennsylvania Germans and percentage of population with a disability under the age of 5 in the United States with a correlation coefficient (R) of 0.587 and weighted average of 1.9%. Similarly, the statistical analysis conducted on geographies consisting of 69,814,894 people shows no correlation between the proportion of Lumbee and percentage of population with a disability under the age of 5 in the United States with a correlation coefficient (R) of -0.042 and weighted average of 1.3%, a difference of 44.7%.
Disability Age Under 5 Correlation Summary
| Measurement | Pennsylvania German | Lumbee |
| Minimum | 1.1% | 0.48% |
| Maximum | 23.1% | 5.9% |
| Range | 22.0% | 5.4% |
| Mean | 5.3% | 1.8% |
| Median | 3.5% | 1.6% |
| Interquartile 25% (IQ1) | 2.1% | 0.69% |
| Interquartile 75% (IQ3) | 6.3% | 2.5% |
| Interquartile Range (IQR) | 4.2% | 1.8% |
| Standard Deviation (Sample) | 5.3% | 1.5% |
| Standard Deviation (Population) | 5.2% | 1.4% |
Similar Demographics by Disability Age Under 5
Demographics Similar to Pennsylvania Germans by Disability Age Under 5
In terms of disability age under 5, the demographic groups most similar to Pennsylvania Germans are Native/Alaskan (1.9%, a difference of 0.38%), Dutch West Indian (1.9%, a difference of 0.78%), Paraguayan (2.0%, a difference of 1.3%), Chippewa (1.9%, a difference of 3.7%), and French Canadian (1.9%, a difference of 3.8%).
| Demographics | Rating | Rank | Disability Age Under 5 |
| Americans | 0.0 /100 | #328 | Tragic 1.9% |
| Houma | 0.0 /100 | #329 | Tragic 1.9% |
| Choctaw | 0.0 /100 | #330 | Tragic 1.9% |
| French Canadians | 0.0 /100 | #331 | Tragic 1.9% |
| Chippewa | 0.0 /100 | #332 | Tragic 1.9% |
| Dutch West Indians | 0.0 /100 | #333 | Tragic 1.9% |
| Natives/Alaskans | 0.0 /100 | #334 | Tragic 1.9% |
| Pennsylvania Germans | 0.0 /100 | #335 | Tragic 1.9% |
| Paraguayans | 0.0 /100 | #336 | Tragic 2.0% |
| Apache | 0.0 /100 | #337 | Tragic 2.0% |
| Tohono O'odham | 0.0 /100 | #338 | Tragic 2.2% |
| Immigrants | Azores | 0.0 /100 | #339 | Tragic 2.2% |
| Menominee | 0.0 /100 | #340 | Tragic 2.3% |
| Tsimshian | 0.0 /100 | #341 | Tragic 2.4% |
| Alaska Natives | 0.0 /100 | #342 | Tragic 2.9% |
Demographics Similar to Lumbee by Disability Age Under 5
In terms of disability age under 5, the demographic groups most similar to Lumbee are Maltese (1.3%, a difference of 0.080%), Native Hawaiian (1.3%, a difference of 0.15%), Immigrants from Austria (1.3%, a difference of 0.18%), Spanish American Indian (1.3%, a difference of 0.34%), and Immigrants from Cameroon (1.4%, a difference of 0.38%).
| Demographics | Rating | Rank | Disability Age Under 5 |
| Central American Indians | 3.6 /100 | #235 | Tragic 1.3% |
| South American Indians | 3.3 /100 | #236 | Tragic 1.3% |
| Basques | 3.0 /100 | #237 | Tragic 1.3% |
| Spanish American Indians | 2.4 /100 | #238 | Tragic 1.3% |
| Immigrants | Austria | 2.3 /100 | #239 | Tragic 1.3% |
| Native Hawaiians | 2.2 /100 | #240 | Tragic 1.3% |
| Maltese | 2.2 /100 | #241 | Tragic 1.3% |
| Lumbee | 2.1 /100 | #242 | Tragic 1.3% |
| Immigrants | Cameroon | 1.7 /100 | #243 | Tragic 1.4% |
| Spaniards | 1.4 /100 | #244 | Tragic 1.4% |
| Potawatomi | 1.1 /100 | #245 | Tragic 1.4% |
| Russians | 1.0 /100 | #246 | Tragic 1.4% |
| Immigrants | England | 1.0 /100 | #247 | Tragic 1.4% |
| Eastern Europeans | 1.0 /100 | #248 | Tragic 1.4% |
| Bermudans | 1.0 /100 | #249 | Tragic 1.4% |