Pennsylvania German vs Immigrants from Latvia Disability Age Under 5
COMPARE
Pennsylvania German
Immigrants from Latvia
Disability Age Under 5
Disability Age Under 5 Comparison
Pennsylvania Germans
Immigrants from Latvia
1.9%
DISABILITY AGE UNDER 5
0.0/ 100
METRIC RATING
335th/ 347
METRIC RANK
1.2%
DISABILITY AGE UNDER 5
50.0/ 100
METRIC RATING
174th/ 347
METRIC RANK
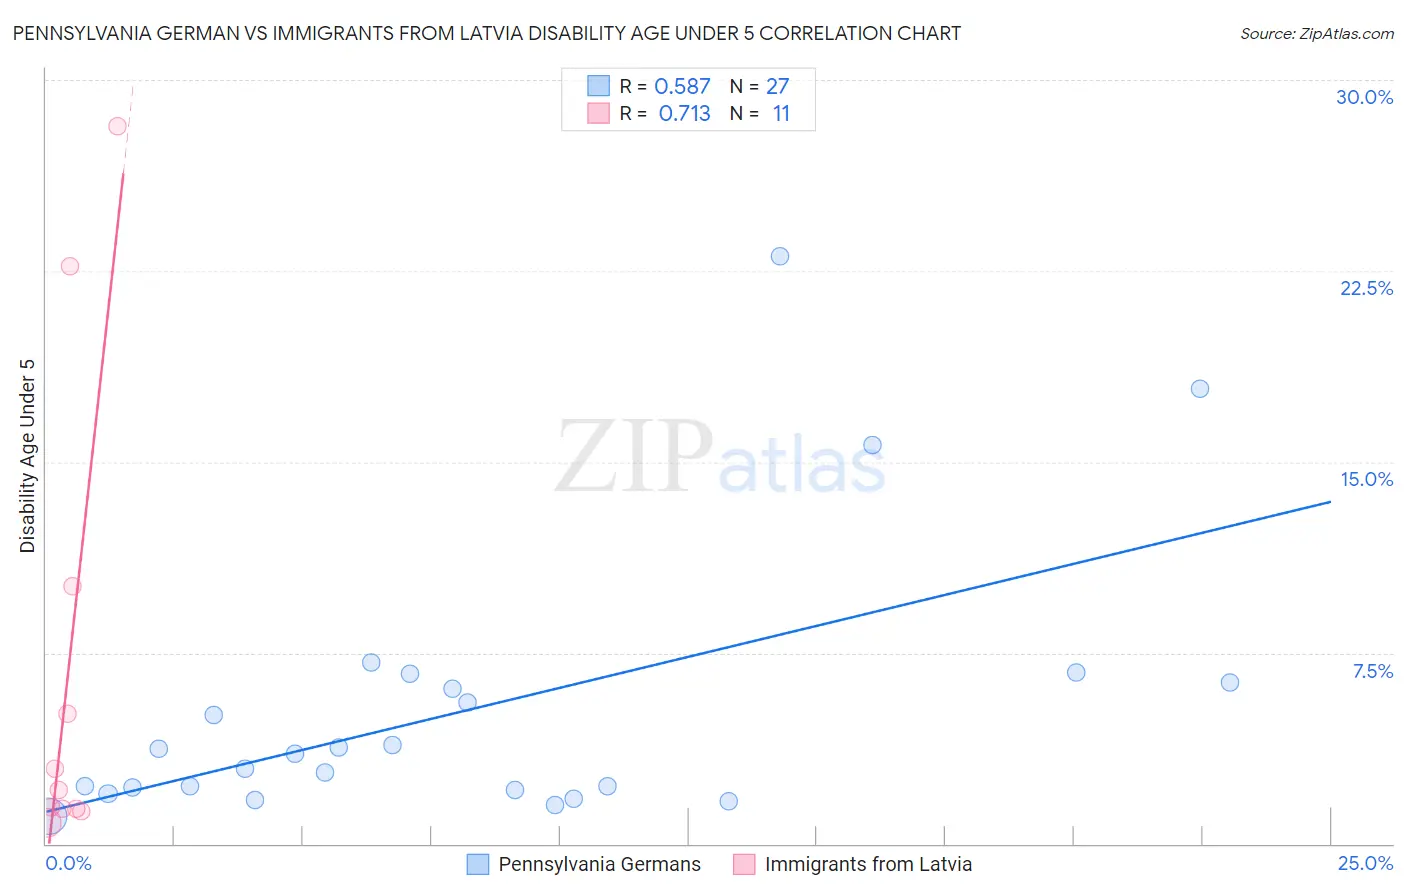
Pennsylvania German vs Immigrants from Latvia Disability Age Under 5 Correlation Chart
The statistical analysis conducted on geographies consisting of 141,367,234 people shows a substantial positive correlation between the proportion of Pennsylvania Germans and percentage of population with a disability under the age of 5 in the United States with a correlation coefficient (R) of 0.587 and weighted average of 1.9%. Similarly, the statistical analysis conducted on geographies consisting of 82,600,960 people shows a strong positive correlation between the proportion of Immigrants from Latvia and percentage of population with a disability under the age of 5 in the United States with a correlation coefficient (R) of 0.713 and weighted average of 1.2%, a difference of 57.3%.
Disability Age Under 5 Correlation Summary
| Measurement | Pennsylvania German | Immigrants from Latvia |
| Minimum | 1.1% | 0.83% |
| Maximum | 23.1% | 28.2% |
| Range | 22.0% | 27.3% |
| Mean | 5.3% | 7.0% |
| Median | 3.5% | 2.1% |
| Interquartile 25% (IQ1) | 2.1% | 1.4% |
| Interquartile 75% (IQ3) | 6.3% | 10.1% |
| Interquartile Range (IQR) | 4.2% | 8.8% |
| Standard Deviation (Sample) | 5.3% | 9.6% |
| Standard Deviation (Population) | 5.2% | 9.1% |
Similar Demographics by Disability Age Under 5
Demographics Similar to Pennsylvania Germans by Disability Age Under 5
In terms of disability age under 5, the demographic groups most similar to Pennsylvania Germans are Native/Alaskan (1.9%, a difference of 0.38%), Dutch West Indian (1.9%, a difference of 0.78%), Paraguayan (2.0%, a difference of 1.3%), Chippewa (1.9%, a difference of 3.7%), and French Canadian (1.9%, a difference of 3.8%).
| Demographics | Rating | Rank | Disability Age Under 5 |
| Americans | 0.0 /100 | #328 | Tragic 1.9% |
| Houma | 0.0 /100 | #329 | Tragic 1.9% |
| Choctaw | 0.0 /100 | #330 | Tragic 1.9% |
| French Canadians | 0.0 /100 | #331 | Tragic 1.9% |
| Chippewa | 0.0 /100 | #332 | Tragic 1.9% |
| Dutch West Indians | 0.0 /100 | #333 | Tragic 1.9% |
| Natives/Alaskans | 0.0 /100 | #334 | Tragic 1.9% |
| Pennsylvania Germans | 0.0 /100 | #335 | Tragic 1.9% |
| Paraguayans | 0.0 /100 | #336 | Tragic 2.0% |
| Apache | 0.0 /100 | #337 | Tragic 2.0% |
| Tohono O'odham | 0.0 /100 | #338 | Tragic 2.2% |
| Immigrants | Azores | 0.0 /100 | #339 | Tragic 2.2% |
| Menominee | 0.0 /100 | #340 | Tragic 2.3% |
| Tsimshian | 0.0 /100 | #341 | Tragic 2.4% |
| Alaska Natives | 0.0 /100 | #342 | Tragic 2.9% |
Demographics Similar to Immigrants from Latvia by Disability Age Under 5
In terms of disability age under 5, the demographic groups most similar to Immigrants from Latvia are Immigrants from Nigeria (1.2%, a difference of 0.0%), Immigrants from Ireland (1.2%, a difference of 0.020%), Crow (1.2%, a difference of 0.090%), Immigrants from Kenya (1.2%, a difference of 0.13%), and Comanche (1.2%, a difference of 0.22%).
| Demographics | Rating | Rank | Disability Age Under 5 |
| Immigrants | Argentina | 60.2 /100 | #167 | Good 1.2% |
| Sierra Leoneans | 59.1 /100 | #168 | Average 1.2% |
| Immigrants | Uruguay | 59.0 /100 | #169 | Average 1.2% |
| Immigrants | Jamaica | 58.8 /100 | #170 | Average 1.2% |
| Guamanians/Chamorros | 57.8 /100 | #171 | Average 1.2% |
| Crow | 51.0 /100 | #172 | Average 1.2% |
| Immigrants | Ireland | 50.3 /100 | #173 | Average 1.2% |
| Immigrants | Latvia | 50.0 /100 | #174 | Average 1.2% |
| Immigrants | Nigeria | 50.0 /100 | #175 | Average 1.2% |
| Immigrants | Kenya | 48.6 /100 | #176 | Average 1.2% |
| Comanche | 47.5 /100 | #177 | Average 1.2% |
| Venezuelans | 47.1 /100 | #178 | Average 1.2% |
| Immigrants | Bahamas | 45.2 /100 | #179 | Average 1.2% |
| Immigrants | Mexico | 44.4 /100 | #180 | Average 1.2% |
| Immigrants | Peru | 43.7 /100 | #181 | Average 1.2% |
| Macedonians | 43.7 /100 | #181 | Average 1.2% |