Nonimmigrants vs Venezuelan Disability Age Under 5
COMPARE
Nonimmigrants
Venezuelan
Disability Age Under 5
Disability Age Under 5 Comparison
Nonimmigrants
Venezuelans
1.6%
DISABILITY AGE UNDER 5
0.0/ 100
METRIC RATING
297th/ 347
METRIC RANK
1.2%
DISABILITY AGE UNDER 5
47.1/ 100
METRIC RATING
178th/ 347
METRIC RANK
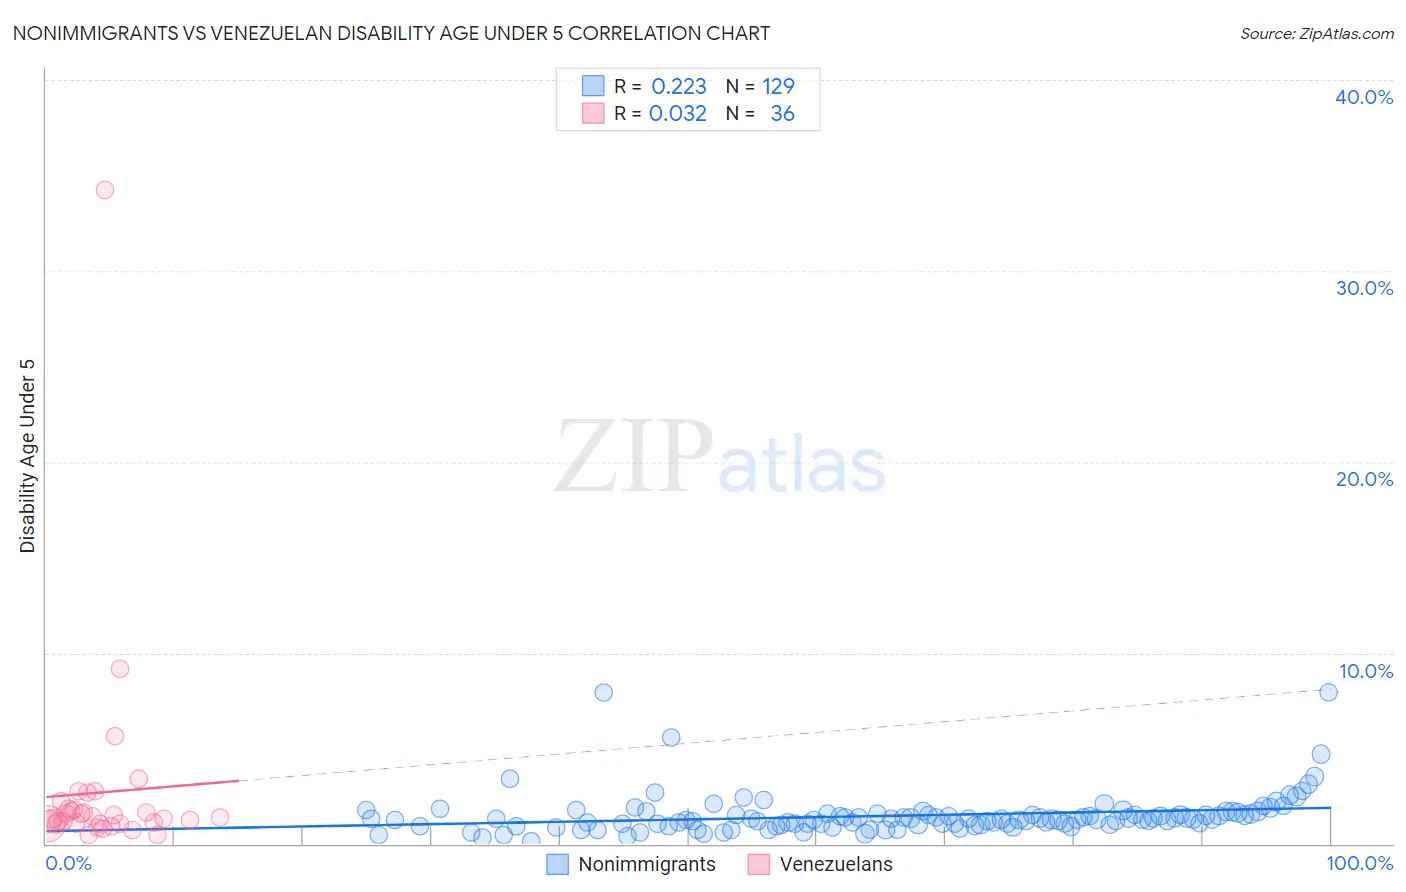
Nonimmigrants vs Venezuelan Disability Age Under 5 Correlation Chart
The statistical analysis conducted on geographies consisting of 262,587,524 people shows a weak positive correlation between the proportion of Nonimmigrants and percentage of population with a disability under the age of 5 in the United States with a correlation coefficient (R) of 0.223 and weighted average of 1.6%. Similarly, the statistical analysis conducted on geographies consisting of 181,706,863 people shows no correlation between the proportion of Venezuelans and percentage of population with a disability under the age of 5 in the United States with a correlation coefficient (R) of 0.032 and weighted average of 1.2%, a difference of 29.2%.
Disability Age Under 5 Correlation Summary
| Measurement | Nonimmigrants | Venezuelan |
| Minimum | 0.14% | 0.44% |
| Maximum | 7.9% | 34.2% |
| Range | 7.8% | 33.8% |
| Mean | 1.5% | 2.7% |
| Median | 1.3% | 1.4% |
| Interquartile 25% (IQ1) | 1.0% | 1.0% |
| Interquartile 75% (IQ3) | 1.5% | 1.8% |
| Interquartile Range (IQR) | 0.54% | 0.76% |
| Standard Deviation (Sample) | 1.1% | 5.6% |
| Standard Deviation (Population) | 1.1% | 5.6% |
Similar Demographics by Disability Age Under 5
Demographics Similar to Nonimmigrants by Disability Age Under 5
In terms of disability age under 5, the demographic groups most similar to Nonimmigrants are Cajun (1.6%, a difference of 0.010%), Portuguese (1.6%, a difference of 0.58%), Shoshone (1.6%, a difference of 0.91%), Polish (1.6%, a difference of 0.96%), and Finnish (1.6%, a difference of 1.0%).
| Demographics | Rating | Rank | Disability Age Under 5 |
| Czechs | 0.0 /100 | #290 | Tragic 1.5% |
| Northern Europeans | 0.0 /100 | #291 | Tragic 1.6% |
| Italians | 0.0 /100 | #292 | Tragic 1.6% |
| Lithuanians | 0.0 /100 | #293 | Tragic 1.6% |
| Swedes | 0.0 /100 | #294 | Tragic 1.6% |
| Finns | 0.0 /100 | #295 | Tragic 1.6% |
| Poles | 0.0 /100 | #296 | Tragic 1.6% |
| Immigrants | Nonimmigrants | 0.0 /100 | #297 | Tragic 1.6% |
| Cajuns | 0.0 /100 | #298 | Tragic 1.6% |
| Portuguese | 0.0 /100 | #299 | Tragic 1.6% |
| Shoshone | 0.0 /100 | #300 | Tragic 1.6% |
| German Russians | 0.0 /100 | #301 | Tragic 1.6% |
| Welsh | 0.0 /100 | #302 | Tragic 1.6% |
| Swiss | 0.0 /100 | #303 | Tragic 1.6% |
| Seminole | 0.0 /100 | #304 | Tragic 1.6% |
Demographics Similar to Venezuelans by Disability Age Under 5
In terms of disability age under 5, the demographic groups most similar to Venezuelans are Comanche (1.2%, a difference of 0.040%), Immigrants from Kenya (1.2%, a difference of 0.14%), Immigrants from Bahamas (1.2%, a difference of 0.17%), Immigrants from Mexico (1.2%, a difference of 0.24%), and Immigrants from Latvia (1.2%, a difference of 0.27%).
| Demographics | Rating | Rank | Disability Age Under 5 |
| Guamanians/Chamorros | 57.8 /100 | #171 | Average 1.2% |
| Crow | 51.0 /100 | #172 | Average 1.2% |
| Immigrants | Ireland | 50.3 /100 | #173 | Average 1.2% |
| Immigrants | Latvia | 50.0 /100 | #174 | Average 1.2% |
| Immigrants | Nigeria | 50.0 /100 | #175 | Average 1.2% |
| Immigrants | Kenya | 48.6 /100 | #176 | Average 1.2% |
| Comanche | 47.5 /100 | #177 | Average 1.2% |
| Venezuelans | 47.1 /100 | #178 | Average 1.2% |
| Immigrants | Bahamas | 45.2 /100 | #179 | Average 1.2% |
| Immigrants | Mexico | 44.4 /100 | #180 | Average 1.2% |
| Immigrants | Peru | 43.7 /100 | #181 | Average 1.2% |
| Macedonians | 43.7 /100 | #181 | Average 1.2% |
| Immigrants | Saudi Arabia | 43.3 /100 | #183 | Average 1.2% |
| Palestinians | 43.0 /100 | #184 | Average 1.2% |
| Immigrants | Western Africa | 42.5 /100 | #185 | Average 1.2% |