Nonimmigrants vs Immigrants from Serbia Disability Age Under 5
COMPARE
Nonimmigrants
Immigrants from Serbia
Disability Age Under 5
Disability Age Under 5 Comparison
Nonimmigrants
Immigrants from Serbia
1.6%
DISABILITY AGE UNDER 5
0.0/ 100
METRIC RATING
297th/ 347
METRIC RANK
1.2%
DISABILITY AGE UNDER 5
87.6/ 100
METRIC RATING
131st/ 347
METRIC RANK
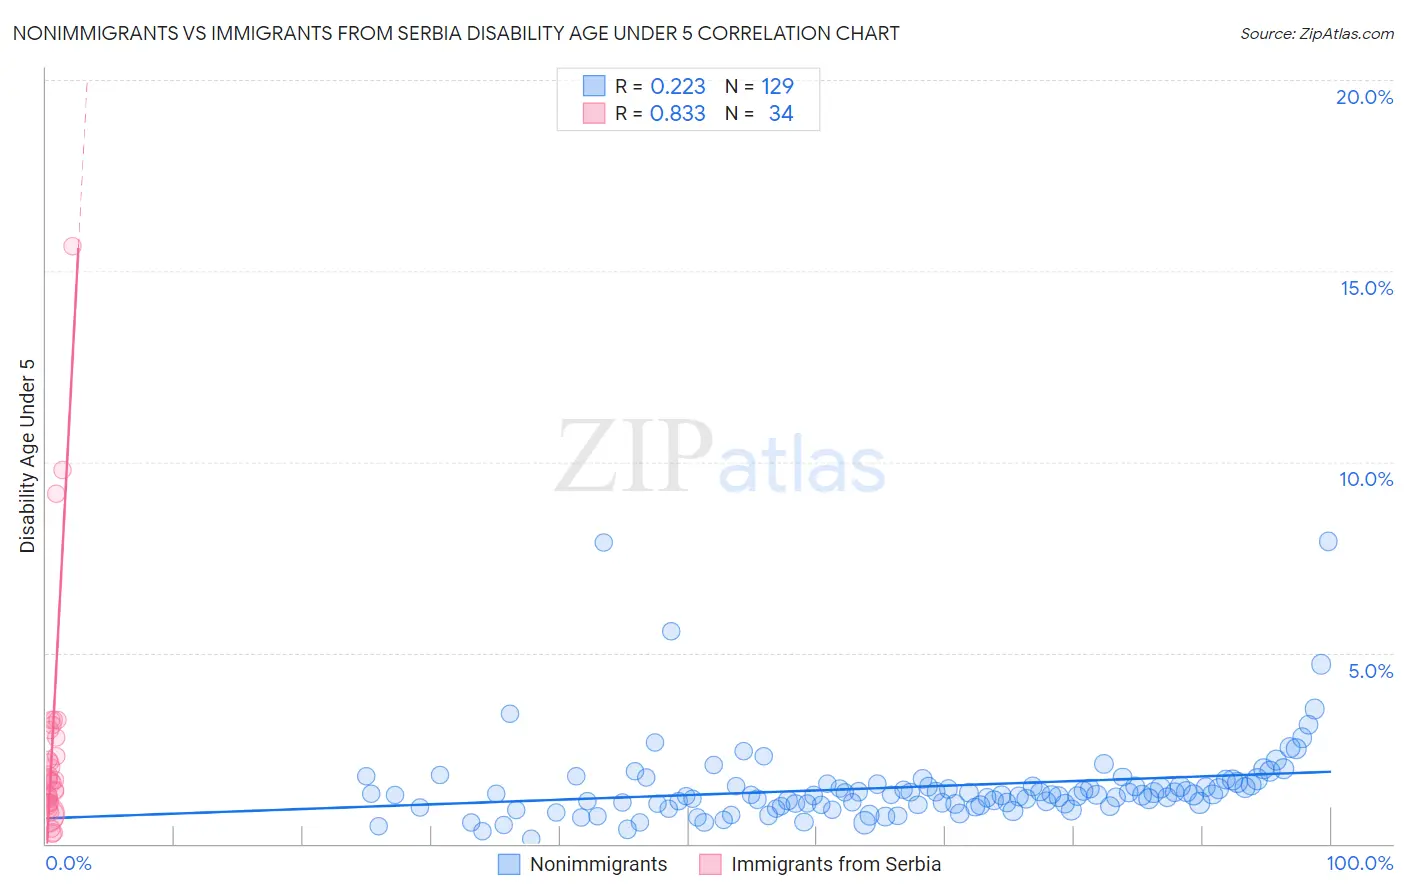
Nonimmigrants vs Immigrants from Serbia Disability Age Under 5 Correlation Chart
The statistical analysis conducted on geographies consisting of 262,587,524 people shows a weak positive correlation between the proportion of Nonimmigrants and percentage of population with a disability under the age of 5 in the United States with a correlation coefficient (R) of 0.223 and weighted average of 1.6%. Similarly, the statistical analysis conducted on geographies consisting of 93,075,533 people shows a very strong positive correlation between the proportion of Immigrants from Serbia and percentage of population with a disability under the age of 5 in the United States with a correlation coefficient (R) of 0.833 and weighted average of 1.2%, a difference of 35.5%.
Disability Age Under 5 Correlation Summary
| Measurement | Nonimmigrants | Immigrants from Serbia |
| Minimum | 0.14% | 0.28% |
| Maximum | 7.9% | 15.7% |
| Range | 7.8% | 15.4% |
| Mean | 1.5% | 2.5% |
| Median | 1.3% | 1.6% |
| Interquartile 25% (IQ1) | 1.0% | 1.1% |
| Interquartile 75% (IQ3) | 1.5% | 2.8% |
| Interquartile Range (IQR) | 0.54% | 1.7% |
| Standard Deviation (Sample) | 1.1% | 3.1% |
| Standard Deviation (Population) | 1.1% | 3.1% |
Similar Demographics by Disability Age Under 5
Demographics Similar to Nonimmigrants by Disability Age Under 5
In terms of disability age under 5, the demographic groups most similar to Nonimmigrants are Cajun (1.6%, a difference of 0.010%), Portuguese (1.6%, a difference of 0.58%), Shoshone (1.6%, a difference of 0.91%), Polish (1.6%, a difference of 0.96%), and Finnish (1.6%, a difference of 1.0%).
| Demographics | Rating | Rank | Disability Age Under 5 |
| Czechs | 0.0 /100 | #290 | Tragic 1.5% |
| Northern Europeans | 0.0 /100 | #291 | Tragic 1.6% |
| Italians | 0.0 /100 | #292 | Tragic 1.6% |
| Lithuanians | 0.0 /100 | #293 | Tragic 1.6% |
| Swedes | 0.0 /100 | #294 | Tragic 1.6% |
| Finns | 0.0 /100 | #295 | Tragic 1.6% |
| Poles | 0.0 /100 | #296 | Tragic 1.6% |
| Immigrants | Nonimmigrants | 0.0 /100 | #297 | Tragic 1.6% |
| Cajuns | 0.0 /100 | #298 | Tragic 1.6% |
| Portuguese | 0.0 /100 | #299 | Tragic 1.6% |
| Shoshone | 0.0 /100 | #300 | Tragic 1.6% |
| German Russians | 0.0 /100 | #301 | Tragic 1.6% |
| Welsh | 0.0 /100 | #302 | Tragic 1.6% |
| Swiss | 0.0 /100 | #303 | Tragic 1.6% |
| Seminole | 0.0 /100 | #304 | Tragic 1.6% |
Demographics Similar to Immigrants from Serbia by Disability Age Under 5
In terms of disability age under 5, the demographic groups most similar to Immigrants from Serbia are Korean (1.2%, a difference of 0.020%), Immigrants from Eastern Europe (1.2%, a difference of 0.070%), Immigrants (1.2%, a difference of 0.090%), Immigrants from Romania (1.2%, a difference of 0.19%), and Immigrants from France (1.2%, a difference of 0.19%).
| Demographics | Rating | Rank | Disability Age Under 5 |
| Immigrants | Cambodia | 90.5 /100 | #124 | Exceptional 1.2% |
| Japanese | 90.3 /100 | #125 | Exceptional 1.2% |
| Central Americans | 89.7 /100 | #126 | Excellent 1.2% |
| Immigrants | Romania | 88.4 /100 | #127 | Excellent 1.2% |
| Immigrants | France | 88.4 /100 | #128 | Excellent 1.2% |
| Immigrants | Immigrants | 88.0 /100 | #129 | Excellent 1.2% |
| Koreans | 87.7 /100 | #130 | Excellent 1.2% |
| Immigrants | Serbia | 87.6 /100 | #131 | Excellent 1.2% |
| Immigrants | Eastern Europe | 87.3 /100 | #132 | Excellent 1.2% |
| Immigrants | Spain | 86.5 /100 | #133 | Excellent 1.2% |
| Argentineans | 85.7 /100 | #134 | Excellent 1.2% |
| Fijians | 84.7 /100 | #135 | Excellent 1.2% |
| Moroccans | 83.6 /100 | #136 | Excellent 1.2% |
| Immigrants | Eastern Africa | 83.1 /100 | #137 | Excellent 1.2% |
| Immigrants | Czechoslovakia | 82.8 /100 | #138 | Excellent 1.2% |