Nonimmigrants vs Shoshone Disability Age Under 5
COMPARE
Nonimmigrants
Shoshone
Disability Age Under 5
Disability Age Under 5 Comparison
Nonimmigrants
Shoshone
1.6%
DISABILITY AGE UNDER 5
0.0/ 100
METRIC RATING
297th/ 347
METRIC RANK
1.6%
DISABILITY AGE UNDER 5
0.0/ 100
METRIC RATING
300th/ 347
METRIC RANK
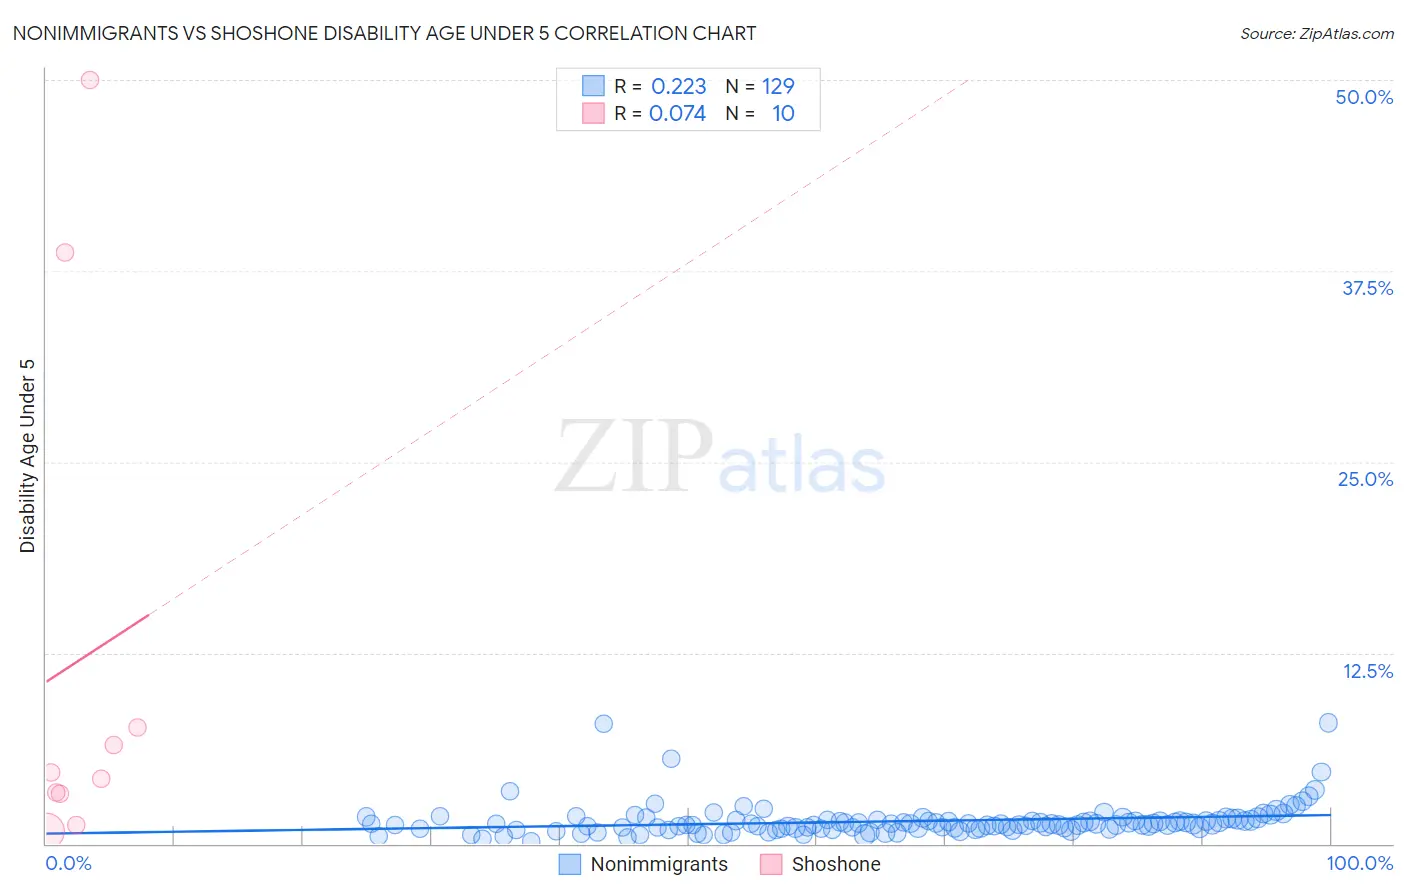
Nonimmigrants vs Shoshone Disability Age Under 5 Correlation Chart
The statistical analysis conducted on geographies consisting of 262,587,524 people shows a weak positive correlation between the proportion of Nonimmigrants and percentage of population with a disability under the age of 5 in the United States with a correlation coefficient (R) of 0.223 and weighted average of 1.6%. Similarly, the statistical analysis conducted on geographies consisting of 55,591,533 people shows a slight positive correlation between the proportion of Shoshone and percentage of population with a disability under the age of 5 in the United States with a correlation coefficient (R) of 0.074 and weighted average of 1.6%, a difference of 0.91%.
Disability Age Under 5 Correlation Summary
| Measurement | Nonimmigrants | Shoshone |
| Minimum | 0.14% | 0.81% |
| Maximum | 7.9% | 50.0% |
| Range | 7.8% | 49.2% |
| Mean | 1.5% | 12.0% |
| Median | 1.3% | 4.5% |
| Interquartile 25% (IQ1) | 1.0% | 3.3% |
| Interquartile 75% (IQ3) | 1.5% | 7.6% |
| Interquartile Range (IQR) | 0.54% | 4.3% |
| Standard Deviation (Sample) | 1.1% | 17.4% |
| Standard Deviation (Population) | 1.1% | 16.5% |
Demographics Similar to Nonimmigrants and Shoshone by Disability Age Under 5
In terms of disability age under 5, the demographic groups most similar to Nonimmigrants are Cajun (1.6%, a difference of 0.010%), Portuguese (1.6%, a difference of 0.58%), Polish (1.6%, a difference of 0.96%), Finnish (1.6%, a difference of 1.0%), and German Russian (1.6%, a difference of 1.4%). Similarly, the demographic groups most similar to Shoshone are Portuguese (1.6%, a difference of 0.33%), German Russian (1.6%, a difference of 0.44%), Welsh (1.6%, a difference of 0.56%), Swiss (1.6%, a difference of 0.72%), and Cajun (1.6%, a difference of 0.91%).
| Demographics | Rating | Rank | Disability Age Under 5 |
| Estonians | 0.0 /100 | #288 | Tragic 1.5% |
| Hungarians | 0.0 /100 | #289 | Tragic 1.5% |
| Czechs | 0.0 /100 | #290 | Tragic 1.5% |
| Northern Europeans | 0.0 /100 | #291 | Tragic 1.6% |
| Italians | 0.0 /100 | #292 | Tragic 1.6% |
| Lithuanians | 0.0 /100 | #293 | Tragic 1.6% |
| Swedes | 0.0 /100 | #294 | Tragic 1.6% |
| Finns | 0.0 /100 | #295 | Tragic 1.6% |
| Poles | 0.0 /100 | #296 | Tragic 1.6% |
| Immigrants | Nonimmigrants | 0.0 /100 | #297 | Tragic 1.6% |
| Cajuns | 0.0 /100 | #298 | Tragic 1.6% |
| Portuguese | 0.0 /100 | #299 | Tragic 1.6% |
| Shoshone | 0.0 /100 | #300 | Tragic 1.6% |
| German Russians | 0.0 /100 | #301 | Tragic 1.6% |
| Welsh | 0.0 /100 | #302 | Tragic 1.6% |
| Swiss | 0.0 /100 | #303 | Tragic 1.6% |
| Seminole | 0.0 /100 | #304 | Tragic 1.6% |
| Blackfeet | 0.0 /100 | #305 | Tragic 1.6% |
| Creek | 0.0 /100 | #306 | Tragic 1.6% |
| Scottish | 0.0 /100 | #307 | Tragic 1.6% |
| Navajo | 0.0 /100 | #308 | Tragic 1.6% |