Immigrants from Peru vs Immigrants from Dominica Disability Age Under 5
COMPARE
Immigrants from Peru
Immigrants from Dominica
Disability Age Under 5
Disability Age Under 5 Comparison
Immigrants from Peru
Immigrants from Dominica
1.2%
DISABILITY AGE UNDER 5
43.7/ 100
METRIC RATING
181st/ 347
METRIC RANK
1.4%
DISABILITY AGE UNDER 5
0.2/ 100
METRIC RATING
262nd/ 347
METRIC RANK
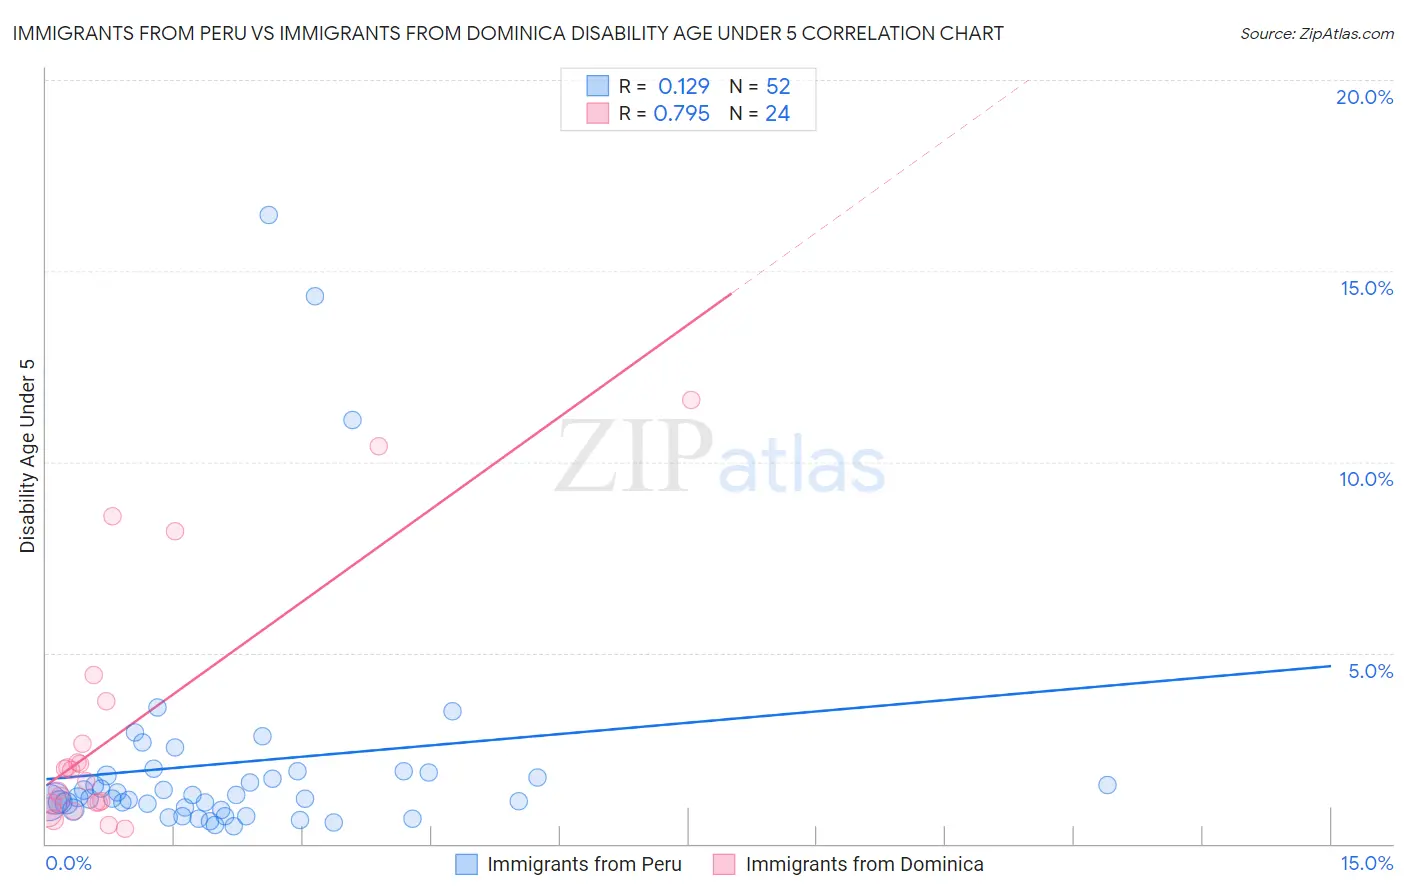
Immigrants from Peru vs Immigrants from Dominica Disability Age Under 5 Correlation Chart
The statistical analysis conducted on geographies consisting of 191,283,198 people shows a poor positive correlation between the proportion of Immigrants from Peru and percentage of population with a disability under the age of 5 in the United States with a correlation coefficient (R) of 0.129 and weighted average of 1.2%. Similarly, the statistical analysis conducted on geographies consisting of 63,480,802 people shows a strong positive correlation between the proportion of Immigrants from Dominica and percentage of population with a disability under the age of 5 in the United States with a correlation coefficient (R) of 0.795 and weighted average of 1.4%, a difference of 13.8%.
Disability Age Under 5 Correlation Summary
| Measurement | Immigrants from Peru | Immigrants from Dominica |
| Minimum | 0.47% | 0.41% |
| Maximum | 16.5% | 11.6% |
| Range | 16.0% | 11.2% |
| Mean | 2.1% | 3.0% |
| Median | 1.2% | 1.8% |
| Interquartile 25% (IQ1) | 0.92% | 1.1% |
| Interquartile 75% (IQ3) | 1.8% | 3.2% |
| Interquartile Range (IQR) | 0.90% | 2.1% |
| Standard Deviation (Sample) | 3.1% | 3.3% |
| Standard Deviation (Population) | 3.1% | 3.2% |
Similar Demographics by Disability Age Under 5
Demographics Similar to Immigrants from Peru by Disability Age Under 5
In terms of disability age under 5, the demographic groups most similar to Immigrants from Peru are Macedonian (1.2%, a difference of 0.0%), Immigrants from Saudi Arabia (1.2%, a difference of 0.040%), Palestinian (1.2%, a difference of 0.060%), Immigrants from Mexico (1.2%, a difference of 0.070%), and Immigrants from Western Africa (1.2%, a difference of 0.11%).
| Demographics | Rating | Rank | Disability Age Under 5 |
| Immigrants | Latvia | 50.0 /100 | #174 | Average 1.2% |
| Immigrants | Nigeria | 50.0 /100 | #175 | Average 1.2% |
| Immigrants | Kenya | 48.6 /100 | #176 | Average 1.2% |
| Comanche | 47.5 /100 | #177 | Average 1.2% |
| Venezuelans | 47.1 /100 | #178 | Average 1.2% |
| Immigrants | Bahamas | 45.2 /100 | #179 | Average 1.2% |
| Immigrants | Mexico | 44.4 /100 | #180 | Average 1.2% |
| Immigrants | Peru | 43.7 /100 | #181 | Average 1.2% |
| Macedonians | 43.7 /100 | #181 | Average 1.2% |
| Immigrants | Saudi Arabia | 43.3 /100 | #183 | Average 1.2% |
| Palestinians | 43.0 /100 | #184 | Average 1.2% |
| Immigrants | Western Africa | 42.5 /100 | #185 | Average 1.2% |
| Cubans | 42.5 /100 | #186 | Average 1.2% |
| Immigrants | Haiti | 40.2 /100 | #187 | Average 1.3% |
| Haitians | 39.9 /100 | #188 | Fair 1.3% |
Demographics Similar to Immigrants from Dominica by Disability Age Under 5
In terms of disability age under 5, the demographic groups most similar to Immigrants from Dominica are Spanish (1.4%, a difference of 0.060%), Immigrants from Netherlands (1.4%, a difference of 0.16%), Yugoslavian (1.4%, a difference of 0.21%), Carpatho Rusyn (1.4%, a difference of 0.25%), and Immigrants from Germany (1.4%, a difference of 0.28%).
| Demographics | Rating | Rank | Disability Age Under 5 |
| Immigrants | Liberia | 0.6 /100 | #255 | Tragic 1.4% |
| Immigrants | Western Europe | 0.5 /100 | #256 | Tragic 1.4% |
| Slovenes | 0.3 /100 | #257 | Tragic 1.4% |
| Costa Ricans | 0.3 /100 | #258 | Tragic 1.4% |
| Immigrants | Southern Europe | 0.3 /100 | #259 | Tragic 1.4% |
| Slavs | 0.3 /100 | #260 | Tragic 1.4% |
| Immigrants | Netherlands | 0.2 /100 | #261 | Tragic 1.4% |
| Immigrants | Dominica | 0.2 /100 | #262 | Tragic 1.4% |
| Spanish | 0.2 /100 | #263 | Tragic 1.4% |
| Yugoslavians | 0.1 /100 | #264 | Tragic 1.4% |
| Carpatho Rusyns | 0.1 /100 | #265 | Tragic 1.4% |
| Immigrants | Germany | 0.1 /100 | #266 | Tragic 1.4% |
| Cree | 0.1 /100 | #267 | Tragic 1.4% |
| Belgians | 0.1 /100 | #268 | Tragic 1.4% |
| Austrians | 0.1 /100 | #269 | Tragic 1.4% |