Immigrants from Peru vs Ottawa Disability Age Under 5
COMPARE
Immigrants from Peru
Ottawa
Disability Age Under 5
Disability Age Under 5 Comparison
Immigrants from Peru
Ottawa
1.2%
DISABILITY AGE UNDER 5
43.7/ 100
METRIC RATING
181st/ 347
METRIC RANK
1.7%
DISABILITY AGE UNDER 5
0.0/ 100
METRIC RATING
321st/ 347
METRIC RANK
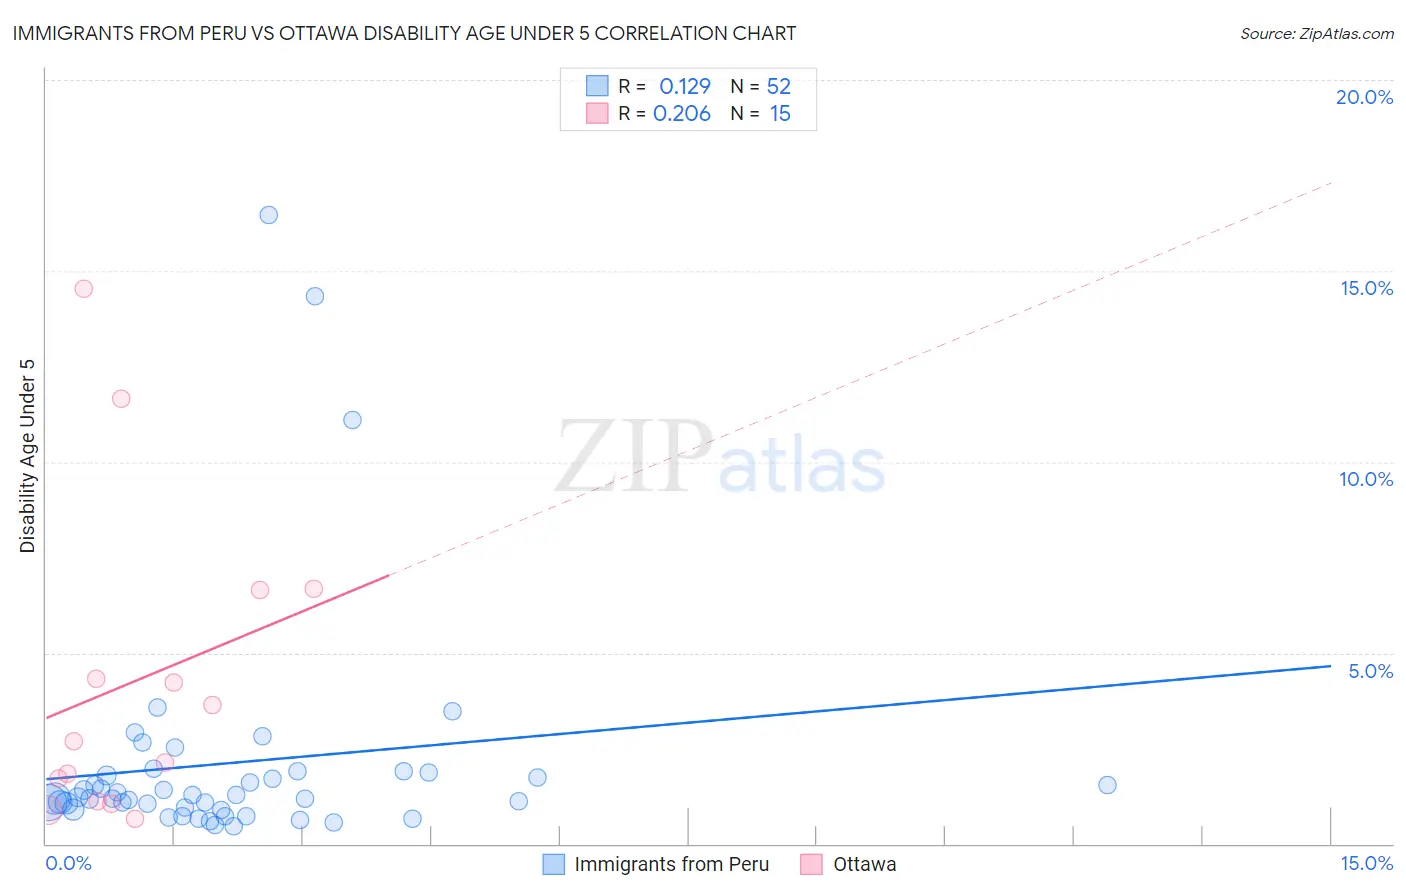
Immigrants from Peru vs Ottawa Disability Age Under 5 Correlation Chart
The statistical analysis conducted on geographies consisting of 191,283,198 people shows a poor positive correlation between the proportion of Immigrants from Peru and percentage of population with a disability under the age of 5 in the United States with a correlation coefficient (R) of 0.129 and weighted average of 1.2%. Similarly, the statistical analysis conducted on geographies consisting of 39,604,340 people shows a weak positive correlation between the proportion of Ottawa and percentage of population with a disability under the age of 5 in the United States with a correlation coefficient (R) of 0.206 and weighted average of 1.7%, a difference of 37.2%.
Disability Age Under 5 Correlation Summary
| Measurement | Immigrants from Peru | Ottawa |
| Minimum | 0.47% | 0.66% |
| Maximum | 16.5% | 14.5% |
| Range | 16.0% | 13.9% |
| Mean | 2.1% | 4.3% |
| Median | 1.2% | 2.7% |
| Interquartile 25% (IQ1) | 0.92% | 1.1% |
| Interquartile 75% (IQ3) | 1.8% | 6.6% |
| Interquartile Range (IQR) | 0.90% | 5.5% |
| Standard Deviation (Sample) | 3.1% | 4.1% |
| Standard Deviation (Population) | 3.1% | 4.0% |
Similar Demographics by Disability Age Under 5
Demographics Similar to Immigrants from Peru by Disability Age Under 5
In terms of disability age under 5, the demographic groups most similar to Immigrants from Peru are Macedonian (1.2%, a difference of 0.0%), Immigrants from Saudi Arabia (1.2%, a difference of 0.040%), Palestinian (1.2%, a difference of 0.060%), Immigrants from Mexico (1.2%, a difference of 0.070%), and Immigrants from Western Africa (1.2%, a difference of 0.11%).
| Demographics | Rating | Rank | Disability Age Under 5 |
| Immigrants | Latvia | 50.0 /100 | #174 | Average 1.2% |
| Immigrants | Nigeria | 50.0 /100 | #175 | Average 1.2% |
| Immigrants | Kenya | 48.6 /100 | #176 | Average 1.2% |
| Comanche | 47.5 /100 | #177 | Average 1.2% |
| Venezuelans | 47.1 /100 | #178 | Average 1.2% |
| Immigrants | Bahamas | 45.2 /100 | #179 | Average 1.2% |
| Immigrants | Mexico | 44.4 /100 | #180 | Average 1.2% |
| Immigrants | Peru | 43.7 /100 | #181 | Average 1.2% |
| Macedonians | 43.7 /100 | #181 | Average 1.2% |
| Immigrants | Saudi Arabia | 43.3 /100 | #183 | Average 1.2% |
| Palestinians | 43.0 /100 | #184 | Average 1.2% |
| Immigrants | Western Africa | 42.5 /100 | #185 | Average 1.2% |
| Cubans | 42.5 /100 | #186 | Average 1.2% |
| Immigrants | Haiti | 40.2 /100 | #187 | Average 1.3% |
| Haitians | 39.9 /100 | #188 | Fair 1.3% |
Demographics Similar to Ottawa by Disability Age Under 5
In terms of disability age under 5, the demographic groups most similar to Ottawa are Scotch-Irish (1.7%, a difference of 0.060%), German (1.7%, a difference of 0.57%), Slovak (1.7%, a difference of 0.59%), Irish (1.7%, a difference of 0.89%), and French (1.7%, a difference of 1.2%).
| Demographics | Rating | Rank | Disability Age Under 5 |
| Norwegians | 0.0 /100 | #314 | Tragic 1.7% |
| Dutch | 0.0 /100 | #315 | Tragic 1.7% |
| Immigrants | Cabo Verde | 0.0 /100 | #316 | Tragic 1.7% |
| French | 0.0 /100 | #317 | Tragic 1.7% |
| Irish | 0.0 /100 | #318 | Tragic 1.7% |
| Slovaks | 0.0 /100 | #319 | Tragic 1.7% |
| Scotch-Irish | 0.0 /100 | #320 | Tragic 1.7% |
| Ottawa | 0.0 /100 | #321 | Tragic 1.7% |
| Germans | 0.0 /100 | #322 | Tragic 1.7% |
| Chickasaw | 0.0 /100 | #323 | Tragic 1.7% |
| Cherokee | 0.0 /100 | #324 | Tragic 1.8% |
| Immigrants | Portugal | 0.0 /100 | #325 | Tragic 1.8% |
| Sioux | 0.0 /100 | #326 | Tragic 1.8% |
| Osage | 0.0 /100 | #327 | Tragic 1.8% |
| Americans | 0.0 /100 | #328 | Tragic 1.9% |