Immigrants from Peru vs German Russian Disability Age Under 5
COMPARE
Immigrants from Peru
German Russian
Disability Age Under 5
Disability Age Under 5 Comparison
Immigrants from Peru
German Russians
1.2%
DISABILITY AGE UNDER 5
43.7/ 100
METRIC RATING
181st/ 347
METRIC RANK
1.6%
DISABILITY AGE UNDER 5
0.0/ 100
METRIC RATING
301st/ 347
METRIC RANK
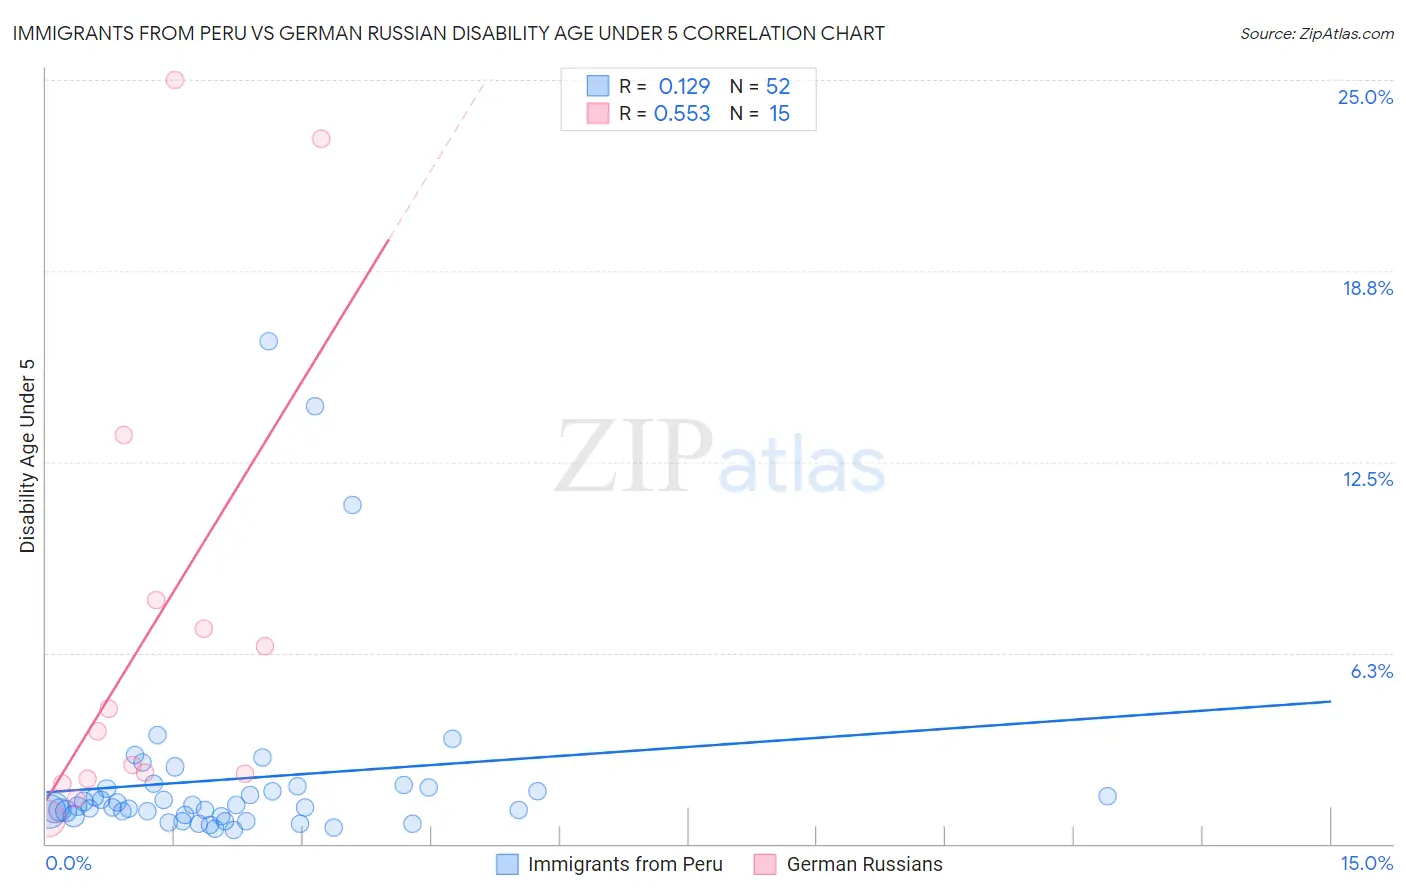
Immigrants from Peru vs German Russian Disability Age Under 5 Correlation Chart
The statistical analysis conducted on geographies consisting of 191,283,198 people shows a poor positive correlation between the proportion of Immigrants from Peru and percentage of population with a disability under the age of 5 in the United States with a correlation coefficient (R) of 0.129 and weighted average of 1.2%. Similarly, the statistical analysis conducted on geographies consisting of 78,222,474 people shows a substantial positive correlation between the proportion of German Russians and percentage of population with a disability under the age of 5 in the United States with a correlation coefficient (R) of 0.553 and weighted average of 1.6%, a difference of 30.5%.
Disability Age Under 5 Correlation Summary
| Measurement | Immigrants from Peru | German Russian |
| Minimum | 0.47% | 0.81% |
| Maximum | 16.5% | 25.0% |
| Range | 16.0% | 24.2% |
| Mean | 2.1% | 7.0% |
| Median | 1.2% | 3.7% |
| Interquartile 25% (IQ1) | 0.92% | 2.1% |
| Interquartile 75% (IQ3) | 1.8% | 8.0% |
| Interquartile Range (IQR) | 0.90% | 5.8% |
| Standard Deviation (Sample) | 3.1% | 7.7% |
| Standard Deviation (Population) | 3.1% | 7.4% |
Similar Demographics by Disability Age Under 5
Demographics Similar to Immigrants from Peru by Disability Age Under 5
In terms of disability age under 5, the demographic groups most similar to Immigrants from Peru are Macedonian (1.2%, a difference of 0.0%), Immigrants from Saudi Arabia (1.2%, a difference of 0.040%), Palestinian (1.2%, a difference of 0.060%), Immigrants from Mexico (1.2%, a difference of 0.070%), and Immigrants from Western Africa (1.2%, a difference of 0.11%).
| Demographics | Rating | Rank | Disability Age Under 5 |
| Immigrants | Latvia | 50.0 /100 | #174 | Average 1.2% |
| Immigrants | Nigeria | 50.0 /100 | #175 | Average 1.2% |
| Immigrants | Kenya | 48.6 /100 | #176 | Average 1.2% |
| Comanche | 47.5 /100 | #177 | Average 1.2% |
| Venezuelans | 47.1 /100 | #178 | Average 1.2% |
| Immigrants | Bahamas | 45.2 /100 | #179 | Average 1.2% |
| Immigrants | Mexico | 44.4 /100 | #180 | Average 1.2% |
| Immigrants | Peru | 43.7 /100 | #181 | Average 1.2% |
| Macedonians | 43.7 /100 | #181 | Average 1.2% |
| Immigrants | Saudi Arabia | 43.3 /100 | #183 | Average 1.2% |
| Palestinians | 43.0 /100 | #184 | Average 1.2% |
| Immigrants | Western Africa | 42.5 /100 | #185 | Average 1.2% |
| Cubans | 42.5 /100 | #186 | Average 1.2% |
| Immigrants | Haiti | 40.2 /100 | #187 | Average 1.3% |
| Haitians | 39.9 /100 | #188 | Fair 1.3% |
Demographics Similar to German Russians by Disability Age Under 5
In terms of disability age under 5, the demographic groups most similar to German Russians are Welsh (1.6%, a difference of 0.12%), Swiss (1.6%, a difference of 0.27%), Shoshone (1.6%, a difference of 0.44%), Portuguese (1.6%, a difference of 0.78%), and Seminole (1.6%, a difference of 0.91%).
| Demographics | Rating | Rank | Disability Age Under 5 |
| Swedes | 0.0 /100 | #294 | Tragic 1.6% |
| Finns | 0.0 /100 | #295 | Tragic 1.6% |
| Poles | 0.0 /100 | #296 | Tragic 1.6% |
| Immigrants | Nonimmigrants | 0.0 /100 | #297 | Tragic 1.6% |
| Cajuns | 0.0 /100 | #298 | Tragic 1.6% |
| Portuguese | 0.0 /100 | #299 | Tragic 1.6% |
| Shoshone | 0.0 /100 | #300 | Tragic 1.6% |
| German Russians | 0.0 /100 | #301 | Tragic 1.6% |
| Welsh | 0.0 /100 | #302 | Tragic 1.6% |
| Swiss | 0.0 /100 | #303 | Tragic 1.6% |
| Seminole | 0.0 /100 | #304 | Tragic 1.6% |
| Blackfeet | 0.0 /100 | #305 | Tragic 1.6% |
| Creek | 0.0 /100 | #306 | Tragic 1.6% |
| Scottish | 0.0 /100 | #307 | Tragic 1.6% |
| Navajo | 0.0 /100 | #308 | Tragic 1.6% |