Delaware vs Yugoslavian Disability Age Under 5
COMPARE
Delaware
Yugoslavian
Disability Age Under 5
Disability Age Under 5 Comparison
Delaware
Yugoslavians
1.5%
DISABILITY AGE UNDER 5
0.0/ 100
METRIC RATING
283rd/ 347
METRIC RANK
1.4%
DISABILITY AGE UNDER 5
0.1/ 100
METRIC RATING
264th/ 347
METRIC RANK
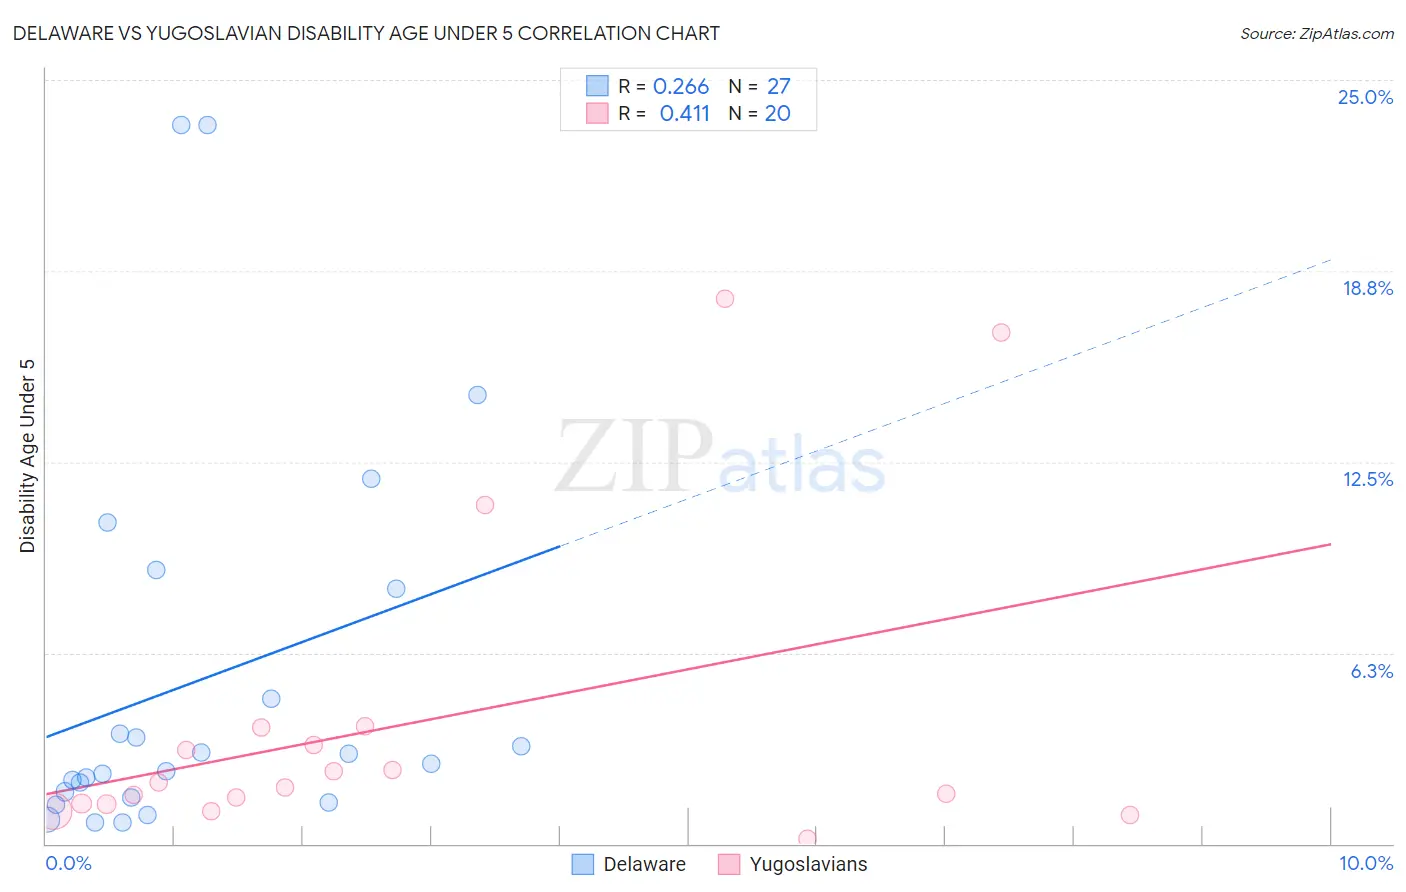
Delaware vs Yugoslavian Disability Age Under 5 Correlation Chart
The statistical analysis conducted on geographies consisting of 72,236,656 people shows a weak positive correlation between the proportion of Delaware and percentage of population with a disability under the age of 5 in the United States with a correlation coefficient (R) of 0.266 and weighted average of 1.5%. Similarly, the statistical analysis conducted on geographies consisting of 169,705,353 people shows a moderate positive correlation between the proportion of Yugoslavians and percentage of population with a disability under the age of 5 in the United States with a correlation coefficient (R) of 0.411 and weighted average of 1.4%, a difference of 6.9%.
Disability Age Under 5 Correlation Summary
| Measurement | Delaware | Yugoslavian |
| Minimum | 0.70% | 0.18% |
| Maximum | 23.5% | 17.9% |
| Range | 22.8% | 17.7% |
| Mean | 5.4% | 3.9% |
| Median | 2.6% | 1.9% |
| Interquartile 25% (IQ1) | 1.5% | 1.3% |
| Interquartile 75% (IQ3) | 8.3% | 3.5% |
| Interquartile Range (IQR) | 6.8% | 2.2% |
| Standard Deviation (Sample) | 6.4% | 5.1% |
| Standard Deviation (Population) | 6.3% | 5.0% |
Demographics Similar to Delaware and Yugoslavians by Disability Age Under 5
In terms of disability age under 5, the demographic groups most similar to Delaware are Cheyenne (1.5%, a difference of 0.19%), Czechoslovakian (1.5%, a difference of 0.54%), British (1.5%, a difference of 2.2%), Danish (1.5%, a difference of 3.0%), and Kiowa (1.5%, a difference of 3.0%). Similarly, the demographic groups most similar to Yugoslavians are Carpatho Rusyn (1.4%, a difference of 0.040%), Immigrants from Germany (1.4%, a difference of 0.080%), Spanish (1.4%, a difference of 0.15%), Cree (1.4%, a difference of 0.60%), and Belgian (1.4%, a difference of 1.2%).
| Demographics | Rating | Rank | Disability Age Under 5 |
| Spanish | 0.2 /100 | #263 | Tragic 1.4% |
| Yugoslavians | 0.1 /100 | #264 | Tragic 1.4% |
| Carpatho Rusyns | 0.1 /100 | #265 | Tragic 1.4% |
| Immigrants | Germany | 0.1 /100 | #266 | Tragic 1.4% |
| Cree | 0.1 /100 | #267 | Tragic 1.4% |
| Belgians | 0.1 /100 | #268 | Tragic 1.4% |
| Austrians | 0.1 /100 | #269 | Tragic 1.4% |
| Immigrants | North America | 0.1 /100 | #270 | Tragic 1.4% |
| Immigrants | Canada | 0.1 /100 | #271 | Tragic 1.4% |
| Blacks/African Americans | 0.1 /100 | #272 | Tragic 1.4% |
| Alaskan Athabascans | 0.1 /100 | #273 | Tragic 1.5% |
| Iroquois | 0.0 /100 | #274 | Tragic 1.5% |
| Brazilians | 0.0 /100 | #275 | Tragic 1.5% |
| Greeks | 0.0 /100 | #276 | Tragic 1.5% |
| Canadians | 0.0 /100 | #277 | Tragic 1.5% |
| Kiowa | 0.0 /100 | #278 | Tragic 1.5% |
| Danes | 0.0 /100 | #279 | Tragic 1.5% |
| British | 0.0 /100 | #280 | Tragic 1.5% |
| Czechoslovakians | 0.0 /100 | #281 | Tragic 1.5% |
| Cheyenne | 0.0 /100 | #282 | Tragic 1.5% |
| Delaware | 0.0 /100 | #283 | Tragic 1.5% |