Delaware vs Immigrants from Sweden Disability Age Under 5
COMPARE
Delaware
Immigrants from Sweden
Disability Age Under 5
Disability Age Under 5 Comparison
Delaware
Immigrants from Sweden
1.5%
DISABILITY AGE UNDER 5
0.0/ 100
METRIC RATING
283rd/ 347
METRIC RANK
1.1%
DISABILITY AGE UNDER 5
99.8/ 100
METRIC RATING
47th/ 347
METRIC RANK
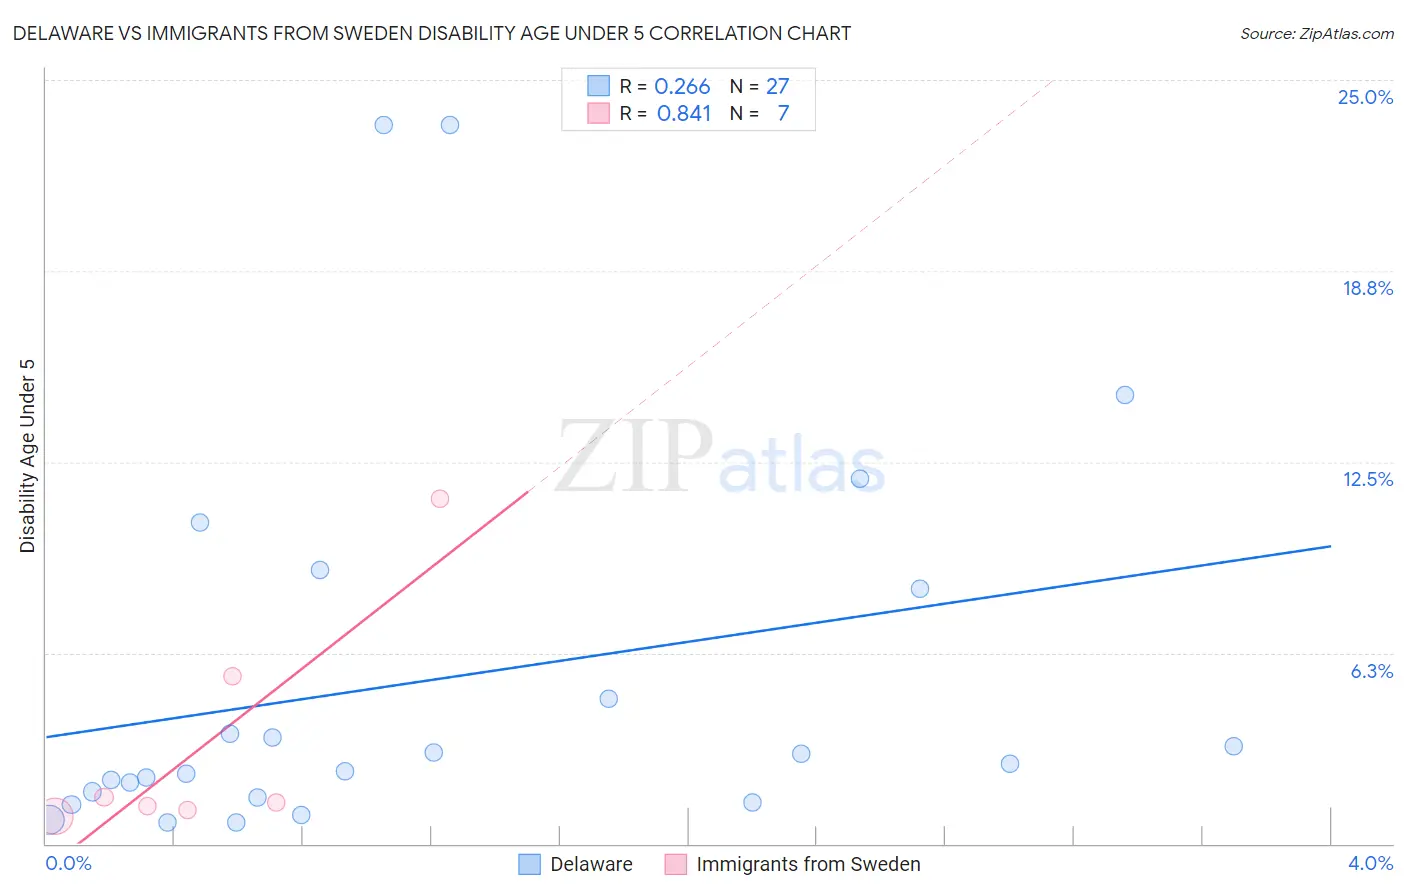
Delaware vs Immigrants from Sweden Disability Age Under 5 Correlation Chart
The statistical analysis conducted on geographies consisting of 72,236,656 people shows a weak positive correlation between the proportion of Delaware and percentage of population with a disability under the age of 5 in the United States with a correlation coefficient (R) of 0.266 and weighted average of 1.5%. Similarly, the statistical analysis conducted on geographies consisting of 109,268,889 people shows a very strong positive correlation between the proportion of Immigrants from Sweden and percentage of population with a disability under the age of 5 in the United States with a correlation coefficient (R) of 0.841 and weighted average of 1.1%, a difference of 42.0%.
Disability Age Under 5 Correlation Summary
| Measurement | Delaware | Immigrants from Sweden |
| Minimum | 0.70% | 0.92% |
| Maximum | 23.5% | 11.3% |
| Range | 22.8% | 10.4% |
| Mean | 5.4% | 3.3% |
| Median | 2.6% | 1.4% |
| Interquartile 25% (IQ1) | 1.5% | 1.1% |
| Interquartile 75% (IQ3) | 8.3% | 5.5% |
| Interquartile Range (IQR) | 6.8% | 4.4% |
| Standard Deviation (Sample) | 6.4% | 3.9% |
| Standard Deviation (Population) | 6.3% | 3.6% |
Similar Demographics by Disability Age Under 5
Demographics Similar to Delaware by Disability Age Under 5
In terms of disability age under 5, the demographic groups most similar to Delaware are European (1.5%, a difference of 0.050%), Cheyenne (1.5%, a difference of 0.19%), Czechoslovakian (1.5%, a difference of 0.54%), Croatian (1.5%, a difference of 1.2%), and Tlingit-Haida (1.5%, a difference of 1.5%).
| Demographics | Rating | Rank | Disability Age Under 5 |
| Greeks | 0.0 /100 | #276 | Tragic 1.5% |
| Canadians | 0.0 /100 | #277 | Tragic 1.5% |
| Kiowa | 0.0 /100 | #278 | Tragic 1.5% |
| Danes | 0.0 /100 | #279 | Tragic 1.5% |
| British | 0.0 /100 | #280 | Tragic 1.5% |
| Czechoslovakians | 0.0 /100 | #281 | Tragic 1.5% |
| Cheyenne | 0.0 /100 | #282 | Tragic 1.5% |
| Delaware | 0.0 /100 | #283 | Tragic 1.5% |
| Europeans | 0.0 /100 | #284 | Tragic 1.5% |
| Croatians | 0.0 /100 | #285 | Tragic 1.5% |
| Tlingit-Haida | 0.0 /100 | #286 | Tragic 1.5% |
| Scandinavians | 0.0 /100 | #287 | Tragic 1.5% |
| Estonians | 0.0 /100 | #288 | Tragic 1.5% |
| Hungarians | 0.0 /100 | #289 | Tragic 1.5% |
| Czechs | 0.0 /100 | #290 | Tragic 1.5% |
Demographics Similar to Immigrants from Sweden by Disability Age Under 5
In terms of disability age under 5, the demographic groups most similar to Immigrants from Sweden are Immigrants from Congo (1.1%, a difference of 0.14%), Immigrants from Singapore (1.1%, a difference of 0.22%), Immigrants from Russia (1.1%, a difference of 0.43%), Immigrants from Japan (1.1%, a difference of 0.44%), and Immigrants from Turkey (1.1%, a difference of 0.54%).
| Demographics | Rating | Rank | Disability Age Under 5 |
| Immigrants | Albania | 99.9 /100 | #40 | Exceptional 1.1% |
| Thais | 99.8 /100 | #41 | Exceptional 1.1% |
| Immigrants | Bulgaria | 99.8 /100 | #42 | Exceptional 1.1% |
| Pima | 99.8 /100 | #43 | Exceptional 1.1% |
| Immigrants | Asia | 99.8 /100 | #44 | Exceptional 1.1% |
| Immigrants | Turkey | 99.8 /100 | #45 | Exceptional 1.1% |
| Immigrants | Congo | 99.8 /100 | #46 | Exceptional 1.1% |
| Immigrants | Sweden | 99.8 /100 | #47 | Exceptional 1.1% |
| Immigrants | Singapore | 99.7 /100 | #48 | Exceptional 1.1% |
| Immigrants | Russia | 99.7 /100 | #49 | Exceptional 1.1% |
| Immigrants | Japan | 99.7 /100 | #50 | Exceptional 1.1% |
| Immigrants | Kazakhstan | 99.7 /100 | #51 | Exceptional 1.1% |
| Immigrants | Bolivia | 99.6 /100 | #52 | Exceptional 1.1% |
| Asians | 99.6 /100 | #53 | Exceptional 1.1% |
| Immigrants | El Salvador | 99.6 /100 | #54 | Exceptional 1.1% |