Delaware vs Choctaw Disability Age Under 5
COMPARE
Delaware
Choctaw
Disability Age Under 5
Disability Age Under 5 Comparison
Delaware
Choctaw
1.5%
DISABILITY AGE UNDER 5
0.0/ 100
METRIC RATING
283rd/ 347
METRIC RANK
1.9%
DISABILITY AGE UNDER 5
0.0/ 100
METRIC RATING
330th/ 347
METRIC RANK
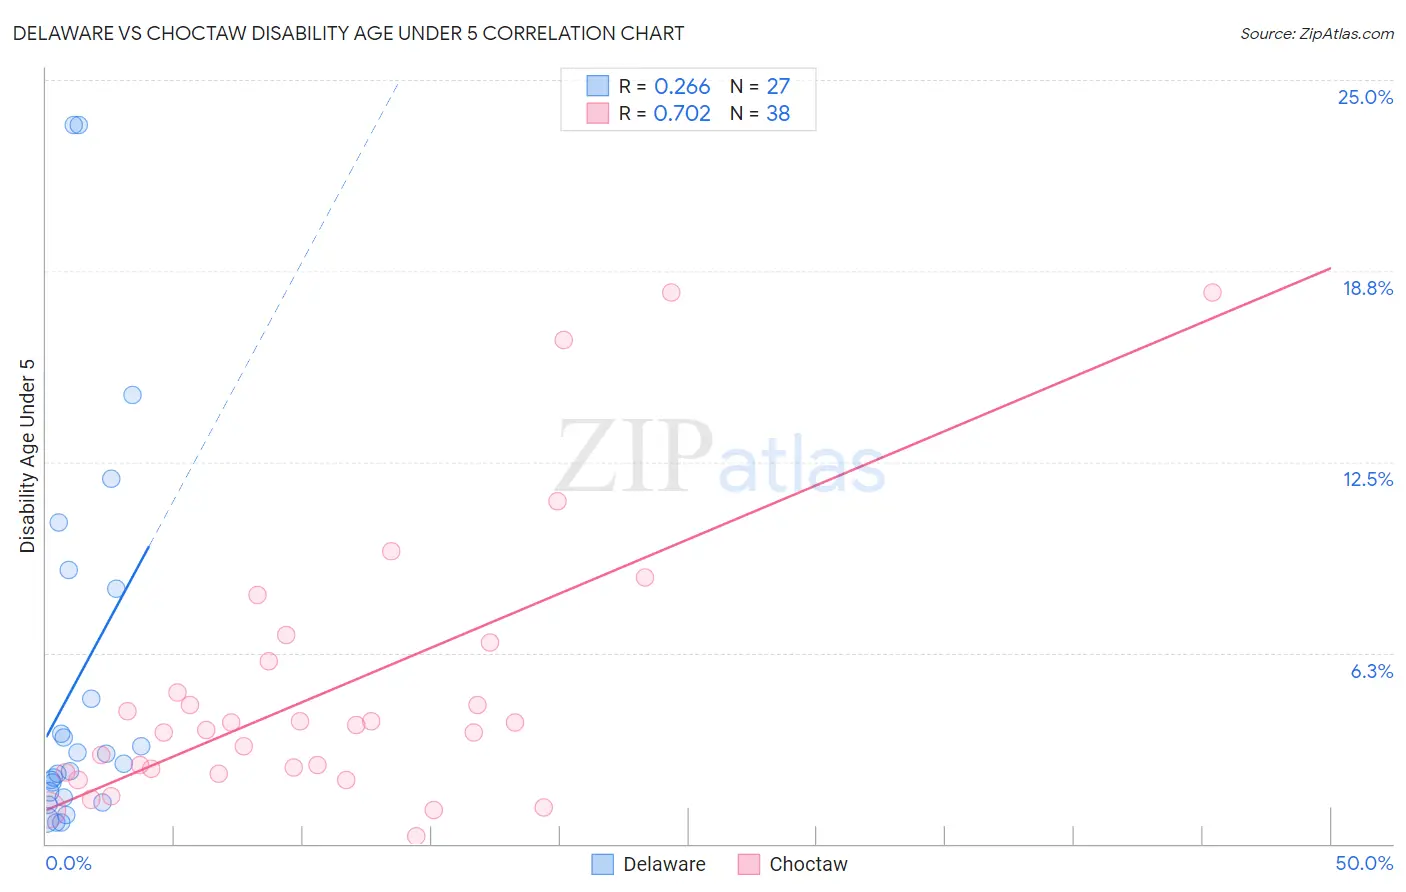
Delaware vs Choctaw Disability Age Under 5 Correlation Chart
The statistical analysis conducted on geographies consisting of 72,236,656 people shows a weak positive correlation between the proportion of Delaware and percentage of population with a disability under the age of 5 in the United States with a correlation coefficient (R) of 0.266 and weighted average of 1.5%. Similarly, the statistical analysis conducted on geographies consisting of 165,165,816 people shows a strong positive correlation between the proportion of Choctaw and percentage of population with a disability under the age of 5 in the United States with a correlation coefficient (R) of 0.702 and weighted average of 1.9%, a difference of 23.2%.
Disability Age Under 5 Correlation Summary
| Measurement | Delaware | Choctaw |
| Minimum | 0.70% | 0.24% |
| Maximum | 23.5% | 18.0% |
| Range | 22.8% | 17.8% |
| Mean | 5.4% | 5.0% |
| Median | 2.6% | 3.8% |
| Interquartile 25% (IQ1) | 1.5% | 2.3% |
| Interquartile 75% (IQ3) | 8.3% | 6.0% |
| Interquartile Range (IQR) | 6.8% | 3.6% |
| Standard Deviation (Sample) | 6.4% | 4.4% |
| Standard Deviation (Population) | 6.3% | 4.4% |
Similar Demographics by Disability Age Under 5
Demographics Similar to Delaware by Disability Age Under 5
In terms of disability age under 5, the demographic groups most similar to Delaware are European (1.5%, a difference of 0.050%), Cheyenne (1.5%, a difference of 0.19%), Czechoslovakian (1.5%, a difference of 0.54%), Croatian (1.5%, a difference of 1.2%), and Tlingit-Haida (1.5%, a difference of 1.5%).
| Demographics | Rating | Rank | Disability Age Under 5 |
| Greeks | 0.0 /100 | #276 | Tragic 1.5% |
| Canadians | 0.0 /100 | #277 | Tragic 1.5% |
| Kiowa | 0.0 /100 | #278 | Tragic 1.5% |
| Danes | 0.0 /100 | #279 | Tragic 1.5% |
| British | 0.0 /100 | #280 | Tragic 1.5% |
| Czechoslovakians | 0.0 /100 | #281 | Tragic 1.5% |
| Cheyenne | 0.0 /100 | #282 | Tragic 1.5% |
| Delaware | 0.0 /100 | #283 | Tragic 1.5% |
| Europeans | 0.0 /100 | #284 | Tragic 1.5% |
| Croatians | 0.0 /100 | #285 | Tragic 1.5% |
| Tlingit-Haida | 0.0 /100 | #286 | Tragic 1.5% |
| Scandinavians | 0.0 /100 | #287 | Tragic 1.5% |
| Estonians | 0.0 /100 | #288 | Tragic 1.5% |
| Hungarians | 0.0 /100 | #289 | Tragic 1.5% |
| Czechs | 0.0 /100 | #290 | Tragic 1.5% |
Demographics Similar to Choctaw by Disability Age Under 5
In terms of disability age under 5, the demographic groups most similar to Choctaw are French Canadian (1.9%, a difference of 0.30%), Houma (1.9%, a difference of 0.32%), Chippewa (1.9%, a difference of 0.36%), American (1.9%, a difference of 0.80%), and Osage (1.8%, a difference of 2.5%).
| Demographics | Rating | Rank | Disability Age Under 5 |
| Chickasaw | 0.0 /100 | #323 | Tragic 1.7% |
| Cherokee | 0.0 /100 | #324 | Tragic 1.8% |
| Immigrants | Portugal | 0.0 /100 | #325 | Tragic 1.8% |
| Sioux | 0.0 /100 | #326 | Tragic 1.8% |
| Osage | 0.0 /100 | #327 | Tragic 1.8% |
| Americans | 0.0 /100 | #328 | Tragic 1.9% |
| Houma | 0.0 /100 | #329 | Tragic 1.9% |
| Choctaw | 0.0 /100 | #330 | Tragic 1.9% |
| French Canadians | 0.0 /100 | #331 | Tragic 1.9% |
| Chippewa | 0.0 /100 | #332 | Tragic 1.9% |
| Dutch West Indians | 0.0 /100 | #333 | Tragic 1.9% |
| Natives/Alaskans | 0.0 /100 | #334 | Tragic 1.9% |
| Pennsylvania Germans | 0.0 /100 | #335 | Tragic 1.9% |
| Paraguayans | 0.0 /100 | #336 | Tragic 2.0% |
| Apache | 0.0 /100 | #337 | Tragic 2.0% |