Cherokee vs Immigrants from Middle Africa Disability Age Under 5
COMPARE
Cherokee
Immigrants from Middle Africa
Disability Age Under 5
Disability Age Under 5 Comparison
Cherokee
Immigrants from Middle Africa
1.8%
DISABILITY AGE UNDER 5
0.0/ 100
METRIC RATING
324th/ 347
METRIC RANK
1.2%
DISABILITY AGE UNDER 5
79.3/ 100
METRIC RATING
144th/ 347
METRIC RANK
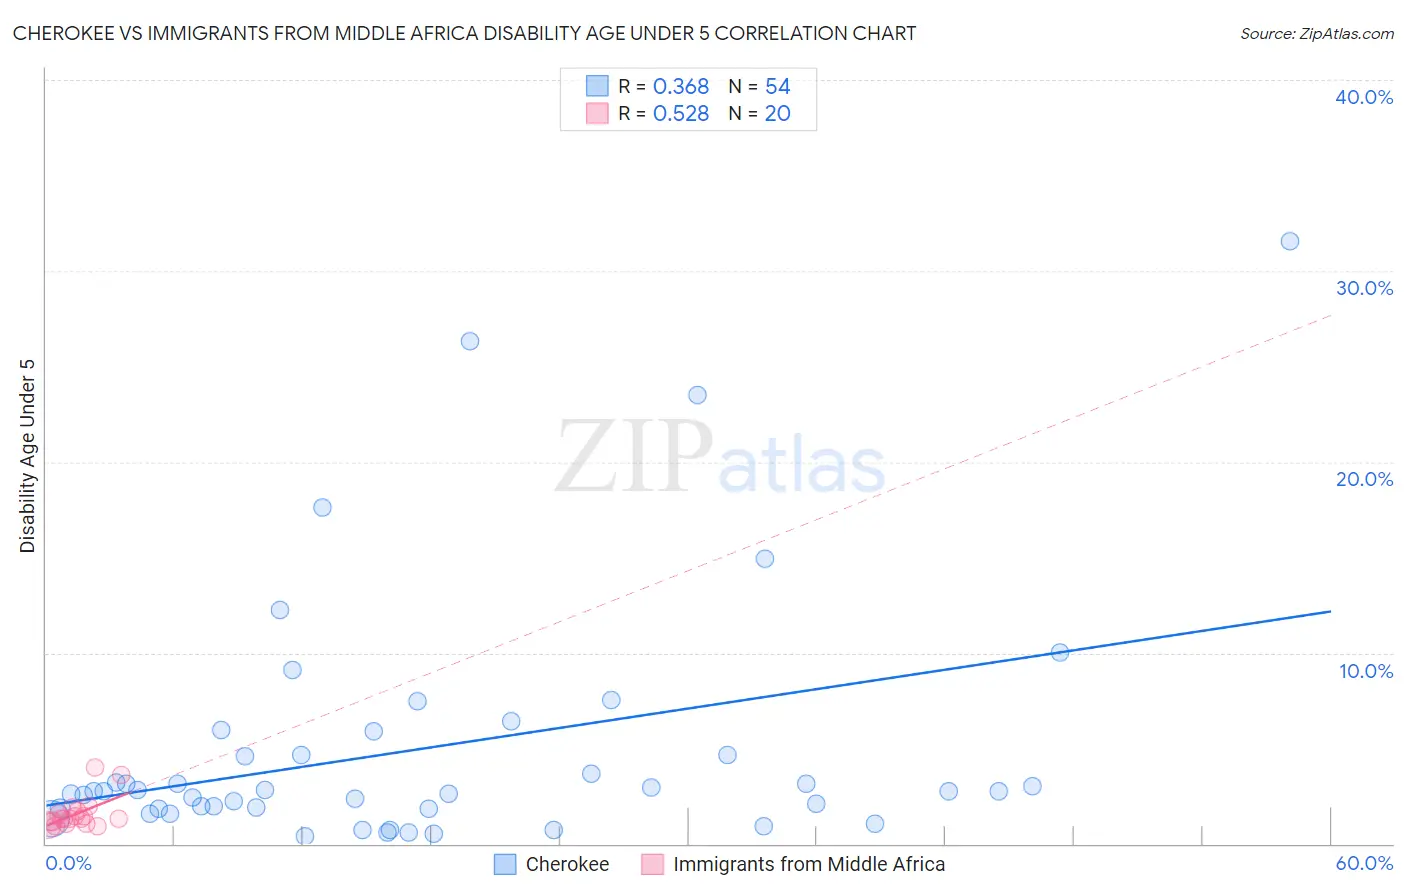
Cherokee vs Immigrants from Middle Africa Disability Age Under 5 Correlation Chart
The statistical analysis conducted on geographies consisting of 245,498,601 people shows a mild positive correlation between the proportion of Cherokee and percentage of population with a disability under the age of 5 in the United States with a correlation coefficient (R) of 0.368 and weighted average of 1.8%. Similarly, the statistical analysis conducted on geographies consisting of 135,378,258 people shows a substantial positive correlation between the proportion of Immigrants from Middle Africa and percentage of population with a disability under the age of 5 in the United States with a correlation coefficient (R) of 0.528 and weighted average of 1.2%, a difference of 47.3%.
Disability Age Under 5 Correlation Summary
| Measurement | Cherokee | Immigrants from Middle Africa |
| Minimum | 0.42% | 0.88% |
| Maximum | 31.6% | 4.0% |
| Range | 31.2% | 3.1% |
| Mean | 5.0% | 1.6% |
| Median | 2.8% | 1.3% |
| Interquartile 25% (IQ1) | 1.9% | 1.1% |
| Interquartile 75% (IQ3) | 4.7% | 1.6% |
| Interquartile Range (IQR) | 2.8% | 0.53% |
| Standard Deviation (Sample) | 6.5% | 0.82% |
| Standard Deviation (Population) | 6.4% | 0.80% |
Similar Demographics by Disability Age Under 5
Demographics Similar to Cherokee by Disability Age Under 5
In terms of disability age under 5, the demographic groups most similar to Cherokee are Immigrants from Portugal (1.8%, a difference of 1.3%), Chickasaw (1.7%, a difference of 1.8%), Sioux (1.8%, a difference of 2.8%), German (1.7%, a difference of 2.9%), and Osage (1.8%, a difference of 3.2%).
| Demographics | Rating | Rank | Disability Age Under 5 |
| French | 0.0 /100 | #317 | Tragic 1.7% |
| Irish | 0.0 /100 | #318 | Tragic 1.7% |
| Slovaks | 0.0 /100 | #319 | Tragic 1.7% |
| Scotch-Irish | 0.0 /100 | #320 | Tragic 1.7% |
| Ottawa | 0.0 /100 | #321 | Tragic 1.7% |
| Germans | 0.0 /100 | #322 | Tragic 1.7% |
| Chickasaw | 0.0 /100 | #323 | Tragic 1.7% |
| Cherokee | 0.0 /100 | #324 | Tragic 1.8% |
| Immigrants | Portugal | 0.0 /100 | #325 | Tragic 1.8% |
| Sioux | 0.0 /100 | #326 | Tragic 1.8% |
| Osage | 0.0 /100 | #327 | Tragic 1.8% |
| Americans | 0.0 /100 | #328 | Tragic 1.9% |
| Houma | 0.0 /100 | #329 | Tragic 1.9% |
| Choctaw | 0.0 /100 | #330 | Tragic 1.9% |
| French Canadians | 0.0 /100 | #331 | Tragic 1.9% |
Demographics Similar to Immigrants from Middle Africa by Disability Age Under 5
In terms of disability age under 5, the demographic groups most similar to Immigrants from Middle Africa are Alsatian (1.2%, a difference of 0.0%), Immigrants from Colombia (1.2%, a difference of 0.010%), Immigrants from Honduras (1.2%, a difference of 0.16%), Immigrants from Zimbabwe (1.2%, a difference of 0.18%), and Somali (1.2%, a difference of 0.22%).
| Demographics | Rating | Rank | Disability Age Under 5 |
| Immigrants | Eastern Africa | 83.1 /100 | #137 | Excellent 1.2% |
| Immigrants | Czechoslovakia | 82.8 /100 | #138 | Excellent 1.2% |
| New Zealanders | 81.4 /100 | #139 | Excellent 1.2% |
| Somalis | 80.8 /100 | #140 | Excellent 1.2% |
| Immigrants | Honduras | 80.4 /100 | #141 | Excellent 1.2% |
| Immigrants | Colombia | 79.3 /100 | #142 | Good 1.2% |
| Alsatians | 79.3 /100 | #143 | Good 1.2% |
| Immigrants | Middle Africa | 79.3 /100 | #144 | Good 1.2% |
| Immigrants | Zimbabwe | 77.9 /100 | #145 | Good 1.2% |
| Samoans | 77.7 /100 | #146 | Good 1.2% |
| Icelanders | 76.3 /100 | #147 | Good 1.2% |
| Ghanaians | 76.3 /100 | #148 | Good 1.2% |
| Kenyans | 75.9 /100 | #149 | Good 1.2% |
| South Americans | 75.6 /100 | #150 | Good 1.2% |
| Yaqui | 74.8 /100 | #151 | Good 1.2% |