Zip Codes with the Highest Percentage of Population Employed in Installation, Maintenance & Repair in West Virginia
RELATED REPORTS & OPTIONS
Installation, Maintenance & Repair
West Virginia
Compare Zip Codes
Map of Zip Codes with the Highest Percentage of Population Employed in Installation, Maintenance & Repair in West Virginia
0.0%
100.0%
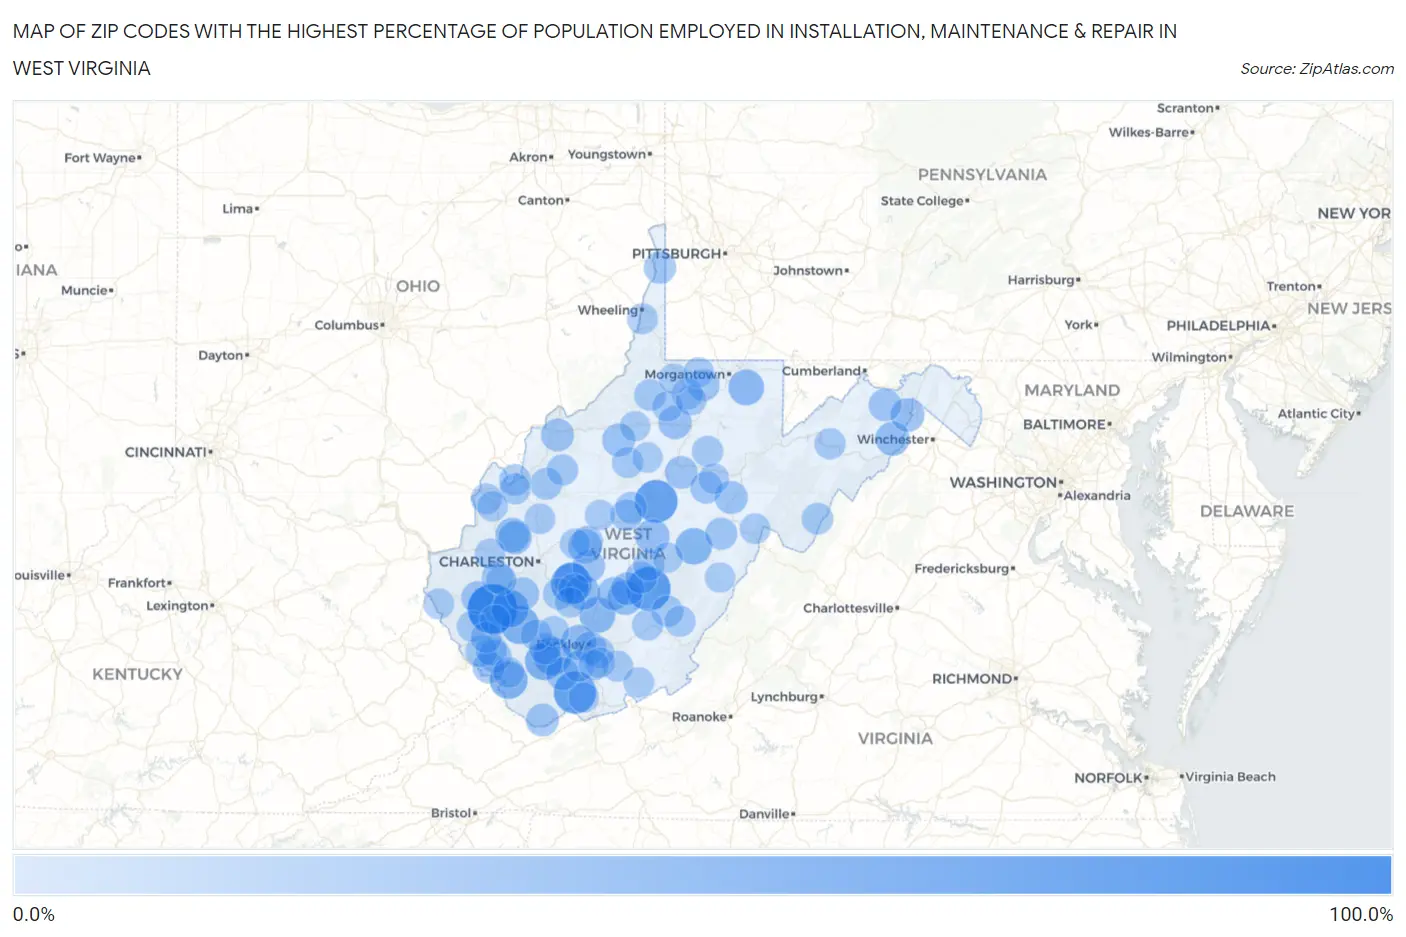
Zip Codes with the Highest Percentage of Population Employed in Installation, Maintenance & Repair in West Virginia
| Zip Code | % Employed | vs State | vs National | |
| 1. | 25505 | 100.0% | 3.9% (+96.1)#1 | 3.1% (+96.9)#4 |
| 2. | 26676 | 72.3% | 3.9% (+68.4)#2 | 3.1% (+69.2)#17 |
| 3. | 26627 | 66.7% | 3.9% (+62.8)#3 | 3.1% (+63.6)#20 |
| 4. | 24736 | 65.5% | 3.9% (+61.6)#4 | 3.1% (+62.4)#27 |
| 5. | 25126 | 57.4% | 3.9% (+53.5)#5 | 3.1% (+54.4)#36 |
| 6. | 25183 | 45.9% | 3.9% (+42.0)#6 | 3.1% (+42.9)#61 |
| 7. | 25845 | 43.8% | 3.9% (+39.9)#7 | 3.1% (+40.8)#76 |
| 8. | 24846 | 43.3% | 3.9% (+39.4)#8 | 3.1% (+40.3)#77 |
| 9. | 24860 | 43.1% | 3.9% (+39.2)#9 | 3.1% (+40.0)#79 |
| 10. | 25203 | 42.0% | 3.9% (+38.0)#10 | 3.1% (+38.9)#87 |
| 11. | 26298 | 37.5% | 3.9% (+33.6)#11 | 3.1% (+34.4)#111 |
| 12. | 25879 | 33.8% | 3.9% (+29.9)#12 | 3.1% (+30.7)#133 |
| 13. | 26524 | 33.3% | 3.9% (+29.4)#13 | 3.1% (+30.3)#136 |
| 14. | 25110 | 31.5% | 3.9% (+27.6)#14 | 3.1% (+28.4)#156 |
| 15. | 25836 | 30.2% | 3.9% (+26.3)#15 | 3.1% (+27.2)#165 |
| 16. | 25040 | 30.1% | 3.9% (+26.2)#16 | 3.1% (+27.1)#167 |
| 17. | 26680 | 29.8% | 3.9% (+25.8)#17 | 3.1% (+26.7)#175 |
| 18. | 26203 | 27.1% | 3.9% (+23.2)#18 | 3.1% (+24.1)#205 |
| 19. | 25109 | 26.9% | 3.9% (+23.0)#19 | 3.1% (+23.8)#209 |
| 20. | 26865 | 25.9% | 3.9% (+22.0)#20 | 3.1% (+22.9)#222 |
| 21. | 25030 | 25.7% | 3.9% (+21.8)#21 | 3.1% (+22.6)#224 |
| 22. | 26817 | 24.1% | 3.9% (+20.2)#22 | 3.1% (+21.1)#260 |
| 23. | 25011 | 23.6% | 3.9% (+19.7)#23 | 3.1% (+20.5)#273 |
| 24. | 26422 | 23.3% | 3.9% (+19.4)#24 | 3.1% (+20.2)#279 |
| 25. | 26421 | 21.9% | 3.9% (+18.0)#25 | 3.1% (+18.9)#323 |
| 26. | 25854 | 21.7% | 3.9% (+17.8)#26 | 3.1% (+18.6)#329 |
| 27. | 25169 | 21.6% | 3.9% (+17.7)#27 | 3.1% (+18.6)#330 |
| 28. | 24847 | 21.2% | 3.9% (+17.2)#28 | 3.1% (+18.1)#345 |
| 29. | 26293 | 20.6% | 3.9% (+16.7)#29 | 3.1% (+17.5)#361 |
| 30. | 26684 | 20.3% | 3.9% (+16.4)#30 | 3.1% (+17.3)#374 |
| 31. | 26142 | 20.1% | 3.9% (+16.2)#31 | 3.1% (+17.0)#390 |
| 32. | 26372 | 20.0% | 3.9% (+16.1)#32 | 3.1% (+16.9)#392 |
| 33. | 25437 | 19.3% | 3.9% (+15.4)#33 | 3.1% (+16.2)#424 |
| 34. | 24866 | 19.2% | 3.9% (+15.3)#34 | 3.1% (+16.1)#431 |
| 35. | 25125 | 19.2% | 3.9% (+15.2)#35 | 3.1% (+16.1)#436 |
| 36. | 25557 | 19.0% | 3.9% (+15.1)#36 | 3.1% (+15.9)#443 |
| 37. | 25644 | 19.0% | 3.9% (+15.1)#37 | 3.1% (+15.9)#444 |
| 38. | 26035 | 17.8% | 3.9% (+13.8)#38 | 3.1% (+14.7)#536 |
| 39. | 26294 | 17.2% | 3.9% (+13.3)#39 | 3.1% (+14.1)#573 |
| 40. | 25911 | 17.2% | 3.9% (+13.3)#40 | 3.1% (+14.1)#576 |
| 41. | 26237 | 17.1% | 3.9% (+13.2)#41 | 3.1% (+14.1)#578 |
| 42. | 26681 | 16.6% | 3.9% (+12.7)#42 | 3.1% (+13.6)#624 |
| 43. | 25252 | 16.0% | 3.9% (+12.1)#43 | 3.1% (+13.0)#675 |
| 44. | 25521 | 15.6% | 3.9% (+11.7)#44 | 3.1% (+12.5)#724 |
| 45. | 26574 | 15.4% | 3.9% (+11.5)#45 | 3.1% (+12.4)#739 |
| 46. | 25692 | 15.3% | 3.9% (+11.4)#46 | 3.1% (+12.3)#749 |
| 47. | 26377 | 14.9% | 3.9% (+10.9)#47 | 3.1% (+11.8)#800 |
| 48. | 24854 | 14.7% | 3.9% (+10.8)#48 | 3.1% (+11.7)#809 |
| 49. | 25262 | 14.7% | 3.9% (+10.8)#49 | 3.1% (+11.6)#811 |
| 50. | 25054 | 14.6% | 3.9% (+10.7)#50 | 3.1% (+11.6)#823 |
| 51. | 26802 | 14.6% | 3.9% (+10.7)#51 | 3.1% (+11.6)#827 |
| 52. | 25670 | 14.6% | 3.9% (+10.7)#52 | 3.1% (+11.5)#828 |
| 53. | 24991 | 14.5% | 3.9% (+10.6)#53 | 3.1% (+11.4)#852 |
| 54. | 25638 | 14.4% | 3.9% (+10.5)#54 | 3.1% (+11.4)#861 |
| 55. | 26624 | 14.1% | 3.9% (+10.2)#55 | 3.1% (+11.0)#914 |
| 56. | 26623 | 13.8% | 3.9% (+9.92)#56 | 3.1% (+10.8)#949 |
| 57. | 25671 | 13.5% | 3.9% (+9.63)#57 | 3.1% (+10.5)#1,005 |
| 58. | 26160 | 13.2% | 3.9% (+9.27)#58 | 3.1% (+10.1)#1,064 |
| 59. | 25208 | 13.0% | 3.9% (+9.13)#59 | 3.1% (+9.98)#1,091 |
| 60. | 25239 | 13.0% | 3.9% (+9.06)#60 | 3.1% (+9.91)#1,105 |
| 61. | 25625 | 12.9% | 3.9% (+8.99)#61 | 3.1% (+9.84)#1,114 |
| 62. | 26238 | 12.9% | 3.9% (+8.95)#62 | 3.1% (+9.80)#1,127 |
| 63. | 25978 | 12.7% | 3.9% (+8.82)#63 | 3.1% (+9.67)#1,154 |
| 64. | 26731 | 12.5% | 3.9% (+8.59)#64 | 3.1% (+9.43)#1,201 |
| 65. | 26205 | 12.5% | 3.9% (+8.57)#65 | 3.1% (+9.41)#1,211 |
| 66. | 24938 | 12.1% | 3.9% (+8.18)#66 | 3.1% (+9.03)#1,296 |
| 67. | 26572 | 12.0% | 3.9% (+8.11)#67 | 3.1% (+8.96)#1,316 |
| 68. | 24977 | 11.8% | 3.9% (+7.93)#68 | 3.1% (+8.77)#1,362 |
| 69. | 25832 | 11.7% | 3.9% (+7.80)#69 | 3.1% (+8.65)#1,396 |
| 70. | 26342 | 11.6% | 3.9% (+7.72)#70 | 3.1% (+8.57)#1,424 |
| 71. | 25915 | 11.6% | 3.9% (+7.68)#71 | 3.1% (+8.53)#1,431 |
| 72. | 25164 | 11.3% | 3.9% (+7.36)#72 | 3.1% (+8.20)#1,533 |
| 73. | 25514 | 11.1% | 3.9% (+7.18)#73 | 3.1% (+8.02)#1,598 |
| 74. | 25608 | 10.9% | 3.9% (+7.03)#74 | 3.1% (+7.88)#1,637 |
| 75. | 26031 | 10.9% | 3.9% (+6.98)#75 | 3.1% (+7.83)#1,656 |
| 76. | 25106 | 10.6% | 3.9% (+6.65)#76 | 3.1% (+7.50)#1,776 |
| 77. | 25248 | 10.3% | 3.9% (+6.35)#77 | 3.1% (+7.20)#1,901 |
| 78. | 26448 | 10.2% | 3.9% (+6.31)#78 | 3.1% (+7.15)#1,927 |
| 79. | 24920 | 10.2% | 3.9% (+6.25)#79 | 3.1% (+7.10)#1,950 |
| 80. | 25136 | 10.0% | 3.9% (+6.07)#80 | 3.1% (+6.91)#2,032 |
| 81. | 26267 | 10.0% | 3.9% (+6.05)#81 | 3.1% (+6.90)#2,038 |
| 82. | 26591 | 9.8% | 3.9% (+5.84)#82 | 3.1% (+6.68)#2,143 |
| 83. | 25187 | 9.6% | 3.9% (+5.71)#83 | 3.1% (+6.56)#2,185 |
| 84. | 25510 | 9.6% | 3.9% (+5.71)#84 | 3.1% (+6.56)#2,189 |
| 85. | 26321 | 9.6% | 3.9% (+5.67)#85 | 3.1% (+6.52)#2,209 |
| 86. | 25140 | 9.6% | 3.9% (+5.67)#86 | 3.1% (+6.51)#2,212 |
| 87. | 24918 | 9.6% | 3.9% (+5.67)#87 | 3.1% (+6.51)#2,213 |
| 88. | 25825 | 9.5% | 3.9% (+5.58)#88 | 3.1% (+6.42)#2,271 |
| 89. | 24747 | 9.4% | 3.9% (+5.49)#89 | 3.1% (+6.34)#2,317 |
| 90. | 26206 | 9.4% | 3.9% (+5.48)#90 | 3.1% (+6.32)#2,325 |
| 91. | 25573 | 9.3% | 3.9% (+5.35)#91 | 3.1% (+6.20)#2,387 |
| 92. | 26585 | 9.3% | 3.9% (+5.35)#92 | 3.1% (+6.20)#2,389 |
| 93. | 26570 | 9.2% | 3.9% (+5.26)#93 | 3.1% (+6.11)#2,453 |
| 94. | 25045 | 8.9% | 3.9% (+5.02)#94 | 3.1% (+5.86)#2,598 |
| 95. | 25843 | 8.9% | 3.9% (+4.94)#95 | 3.1% (+5.79)#2,652 |
| 96. | 24954 | 8.8% | 3.9% (+4.90)#96 | 3.1% (+5.75)#2,686 |
| 97. | 25508 | 8.6% | 3.9% (+4.73)#97 | 3.1% (+5.57)#2,801 |
| 98. | 25235 | 8.6% | 3.9% (+4.71)#98 | 3.1% (+5.55)#2,811 |
| 99. | 26456 | 8.5% | 3.9% (+4.57)#99 | 3.1% (+5.42)#2,892 |
| 100. | 25083 | 8.5% | 3.9% (+4.56)#100 | 3.1% (+5.41)#2,901 |
Common Questions
What are the Top 10 Zip Codes with the Highest Percentage of Population Employed in Installation, Maintenance & Repair in West Virginia?
Top 10 Zip Codes with the Highest Percentage of Population Employed in Installation, Maintenance & Repair in West Virginia are:
What zip code has the Highest Percentage of Population Employed in Installation, Maintenance & Repair in West Virginia?
25505 has the Highest Percentage of Population Employed in Installation, Maintenance & Repair in West Virginia with 100.0%.
What is the Percentage of Population Employed in Installation, Maintenance & Repair in the State of West Virginia?
Percentage of Population Employed in Installation, Maintenance & Repair in West Virginia is 3.9%.
What is the Percentage of Population Employed in Installation, Maintenance & Repair in the United States?
Percentage of Population Employed in Installation, Maintenance & Repair in the United States is 3.1%.