Zip Codes with the Highest Percentage of Population Employed in Administrative & Support Services in San Jacinto, CA
RELATED REPORTS & OPTIONS
Administrative & Support Services
San Jacinto
Compare Zip Codes
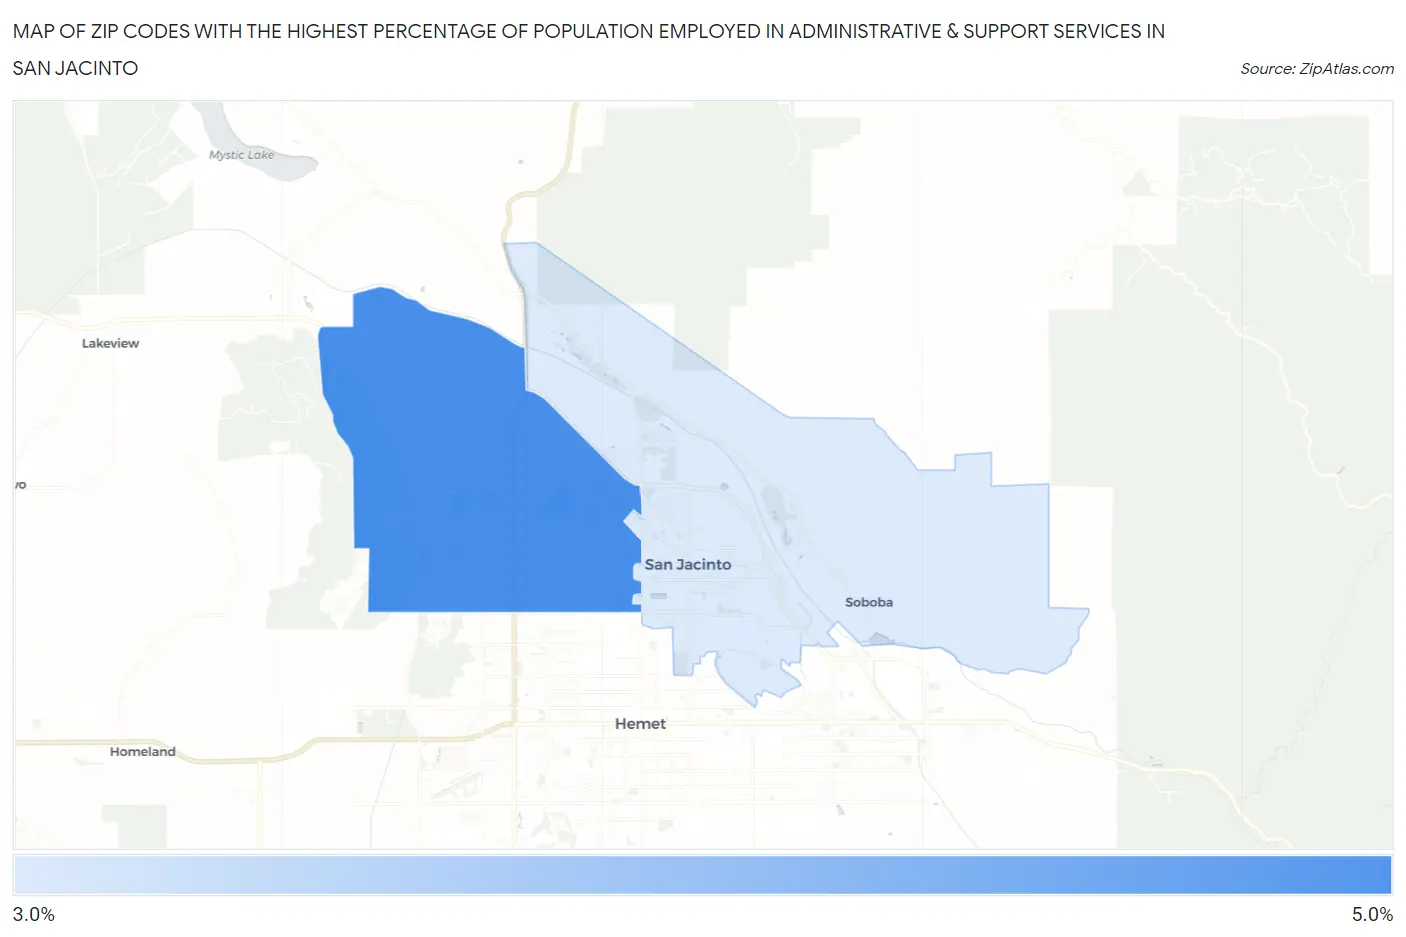
Map of Zip Codes with the Highest Percentage of Population Employed in Administrative & Support Services in San Jacinto
3.9%
4.6%
Zip Codes with the Highest Percentage of Population Employed in Administrative & Support Services in San Jacinto, CA
| Zip Code | % Employed | vs State | vs National | |
| 1. | 92582 | 4.6% | 4.6%(+0.012)#637 | 4.1%(+0.431)#8,436 |
| 2. | 92583 | 3.9% | 4.6%(-0.636)#803 | 4.1%(-0.216)#10,958 |
1
Common Questions
What are the Top Zip Codes with the Highest Percentage of Population Employed in Administrative & Support Services in San Jacinto, CA?
Top Zip Codes with the Highest Percentage of Population Employed in Administrative & Support Services in San Jacinto, CA are:
What zip code has the Highest Percentage of Population Employed in Administrative & Support Services in San Jacinto, CA?
92582 has the Highest Percentage of Population Employed in Administrative & Support Services in San Jacinto, CA with 4.6%.
What is the Percentage of Population Employed in Administrative & Support Services in San Jacinto, CA?
Percentage of Population Employed in Administrative & Support Services in San Jacinto is 4.4%.
What is the Percentage of Population Employed in Administrative & Support Services in California?
Percentage of Population Employed in Administrative & Support Services in California is 4.6%.
What is the Percentage of Population Employed in Administrative & Support Services in the United States?
Percentage of Population Employed in Administrative & Support Services in the United States is 4.1%.