Zip Codes with the Highest Percentage of Population Employed in Sales & Related in Arkansas
RELATED REPORTS & OPTIONS
Sales & Related
Arkansas
Compare Zip Codes
Map of Zip Codes with the Highest Percentage of Population Employed in Sales & Related in Arkansas
10.0%
60.0%
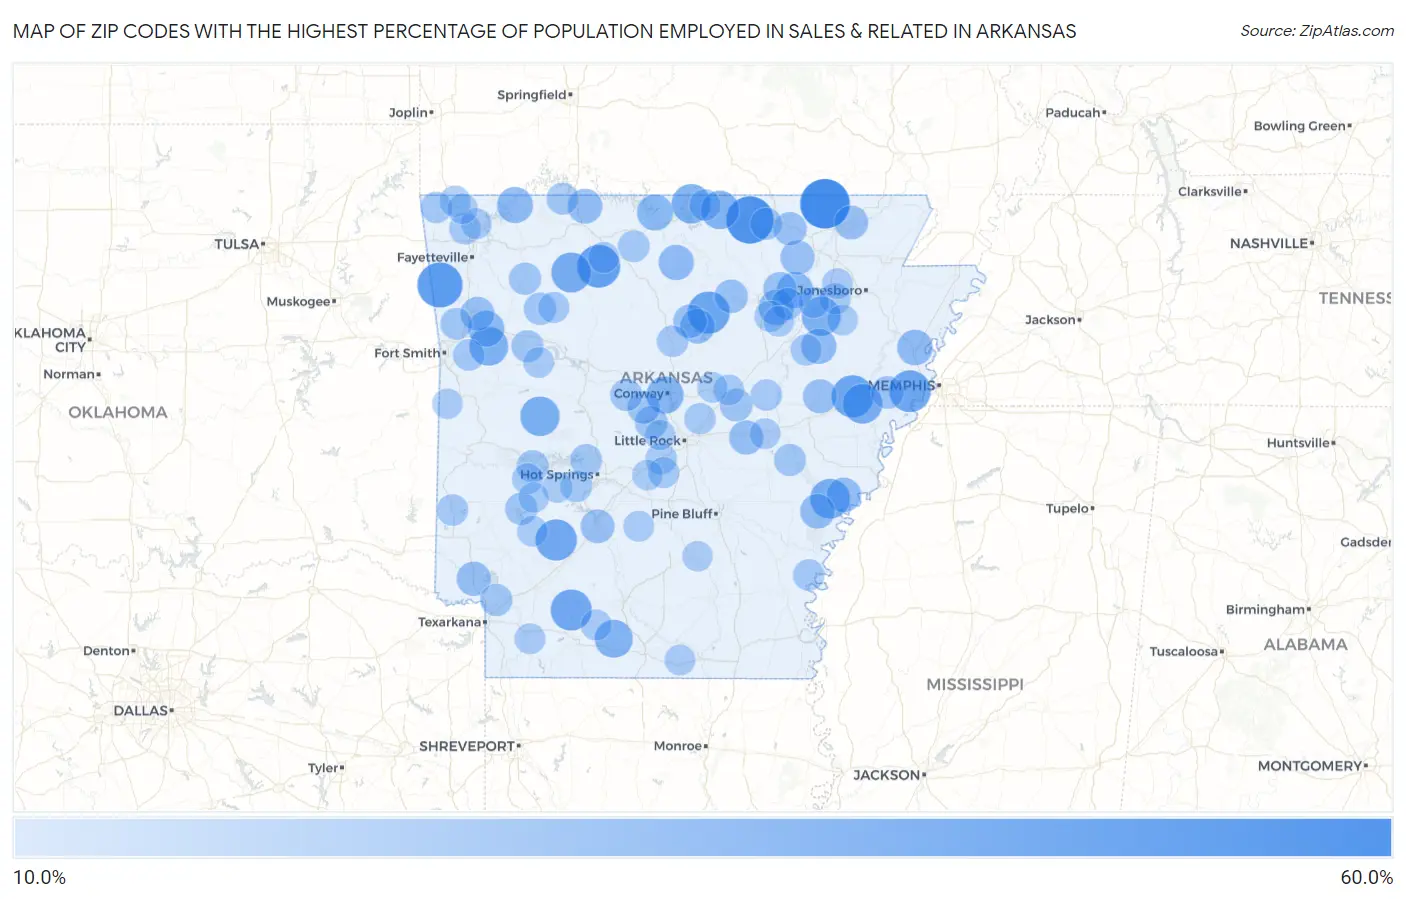
Zip Codes with the Highest Percentage of Population Employed in Sales & Related in Arkansas
| Zip Code | % Employed | vs State | vs National | |
| 1. | 72478 | 51.6% | 9.8% (+41.8)#1 | 9.6% (+42.0)#95 |
| 2. | 72539 | 47.1% | 9.8% (+37.2)#2 | 9.6% (+37.5)#141 |
| 3. | 72749 | 42.5% | 9.8% (+32.6)#3 | 9.6% (+32.9)#179 |
| 4. | 72640 | 38.3% | 9.8% (+28.5)#4 | 9.6% (+28.7)#220 |
| 5. | 72130 | 36.5% | 9.8% (+26.6)#5 | 9.6% (+26.9)#247 |
| 6. | 72322 | 36.4% | 9.8% (+26.5)#6 | 9.6% (+26.8)#249 |
| 7. | 72332 | 35.7% | 9.8% (+25.9)#7 | 9.6% (+26.1)#261 |
| 8. | 71922 | 34.9% | 9.8% (+25.1)#8 | 9.6% (+25.3)#276 |
| 9. | 71864 | 34.6% | 9.8% (+24.8)#9 | 9.6% (+25.0)#281 |
| 10. | 72666 | 32.3% | 9.8% (+22.4)#10 | 9.6% (+22.7)#337 |
| 11. | 72359 | 31.9% | 9.8% (+22.0)#11 | 9.6% (+22.3)#352 |
| 12. | 72353 | 31.8% | 9.8% (+22.0)#12 | 9.6% (+22.2)#354 |
| 13. | 72828 | 31.2% | 9.8% (+21.4)#13 | 9.6% (+21.7)#371 |
| 14. | 72537 | 30.9% | 9.8% (+21.1)#14 | 9.6% (+21.3)#379 |
| 15. | 72431 | 30.2% | 9.8% (+20.4)#15 | 9.6% (+20.6)#393 |
| 16. | 72930 | 29.9% | 9.8% (+20.0)#16 | 9.6% (+20.3)#405 |
| 17. | 72583 | 29.0% | 9.8% (+19.2)#17 | 9.6% (+19.4)#434 |
| 18. | 71758 | 28.3% | 9.8% (+18.5)#18 | 9.6% (+18.7)#464 |
| 19. | 72035 | 26.9% | 9.8% (+17.1)#19 | 9.6% (+17.3)#524 |
| 20. | 72947 | 24.8% | 9.8% (+15.0)#20 | 9.6% (+15.2)#659 |
| 21. | 72642 | 24.7% | 9.8% (+14.9)#21 | 9.6% (+15.1)#668 |
| 22. | 72524 | 24.7% | 9.8% (+14.8)#22 | 9.6% (+15.1)#672 |
| 23. | 72631 | 24.5% | 9.8% (+14.6)#23 | 9.6% (+14.9)#688 |
| 24. | 72339 | 23.4% | 9.8% (+13.6)#24 | 9.6% (+13.8)#765 |
| 25. | 72553 | 23.1% | 9.8% (+13.3)#25 | 9.6% (+13.5)#792 |
| 26. | 72014 | 23.1% | 9.8% (+13.3)#26 | 9.6% (+13.5)#793 |
| 27. | 72617 | 23.0% | 9.8% (+13.2)#27 | 9.6% (+13.4)#796 |
| 28. | 72662 | 22.0% | 9.8% (+12.2)#28 | 9.6% (+12.4)#896 |
| 29. | 72389 | 21.9% | 9.8% (+12.1)#29 | 9.6% (+12.3)#903 |
| 30. | 72048 | 21.9% | 9.8% (+12.1)#30 | 9.6% (+12.3)#911 |
| 31. | 72067 | 21.8% | 9.8% (+12.0)#31 | 9.6% (+12.2)#921 |
| 32. | 71865 | 21.0% | 9.8% (+11.2)#32 | 9.6% (+11.4)#1,015 |
| 33. | 72024 | 20.9% | 9.8% (+11.1)#33 | 9.6% (+11.3)#1,021 |
| 34. | 72466 | 20.7% | 9.8% (+10.9)#34 | 9.6% (+11.1)#1,057 |
| 35. | 72074 | 20.7% | 9.8% (+10.9)#35 | 9.6% (+11.1)#1,066 |
| 36. | 72413 | 20.4% | 9.8% (+10.5)#36 | 9.6% (+10.8)#1,103 |
| 37. | 72946 | 20.3% | 9.8% (+10.4)#37 | 9.6% (+10.7)#1,122 |
| 38. | 71998 | 20.1% | 9.8% (+10.3)#38 | 9.6% (+10.5)#1,138 |
| 39. | 72088 | 19.7% | 9.8% (+9.92)#39 | 9.6% (+10.1)#1,190 |
| 40. | 72579 | 19.5% | 9.8% (+9.70)#40 | 9.6% (+9.92)#1,230 |
| 41. | 72555 | 19.3% | 9.8% (+9.50)#41 | 9.6% (+9.72)#1,274 |
| 42. | 72482 | 19.3% | 9.8% (+9.46)#42 | 9.6% (+9.69)#1,282 |
| 43. | 72176 | 18.3% | 9.8% (+8.46)#43 | 9.6% (+8.68)#1,492 |
| 44. | 72135 | 18.3% | 9.8% (+8.46)#44 | 9.6% (+8.68)#1,493 |
| 45. | 72346 | 18.2% | 9.8% (+8.36)#45 | 9.6% (+8.59)#1,522 |
| 46. | 72016 | 18.1% | 9.8% (+8.32)#46 | 9.6% (+8.54)#1,545 |
| 47. | 71950 | 17.4% | 9.8% (+7.63)#47 | 9.6% (+7.85)#1,705 |
| 48. | 72852 | 17.4% | 9.8% (+7.57)#48 | 9.6% (+7.80)#1,721 |
| 49. | 72776 | 17.2% | 9.8% (+7.39)#49 | 9.6% (+7.61)#1,769 |
| 50. | 71853 | 17.1% | 9.8% (+7.25)#50 | 9.6% (+7.48)#1,816 |
| 51. | 71957 | 17.0% | 9.8% (+7.14)#51 | 9.6% (+7.37)#1,845 |
| 52. | 72832 | 16.9% | 9.8% (+7.04)#52 | 9.6% (+7.27)#1,882 |
| 53. | 72125 | 16.7% | 9.8% (+6.85)#53 | 9.6% (+7.07)#1,938 |
| 54. | 72134 | 16.7% | 9.8% (+6.85)#54 | 9.6% (+7.07)#1,939 |
| 55. | 72529 | 16.5% | 9.8% (+6.68)#55 | 9.6% (+6.91)#2,018 |
| 56. | 72660 | 16.4% | 9.8% (+6.60)#56 | 9.6% (+6.83)#2,047 |
| 57. | 72562 | 16.3% | 9.8% (+6.47)#57 | 9.6% (+6.69)#2,103 |
| 58. | 71956 | 16.2% | 9.8% (+6.40)#58 | 9.6% (+6.63)#2,137 |
| 59. | 72952 | 16.2% | 9.8% (+6.40)#59 | 9.6% (+6.62)#2,138 |
| 60. | 71964 | 16.1% | 9.8% (+6.28)#60 | 9.6% (+6.51)#2,183 |
| 61. | 72682 | 16.1% | 9.8% (+6.27)#61 | 9.6% (+6.50)#2,190 |
| 62. | 72718 | 15.7% | 9.8% (+5.88)#62 | 9.6% (+6.11)#2,375 |
| 63. | 71674 | 15.6% | 9.8% (+5.80)#63 | 9.6% (+6.03)#2,410 |
| 64. | 72013 | 15.6% | 9.8% (+5.75)#64 | 9.6% (+5.98)#2,433 |
| 65. | 71944 | 15.5% | 9.8% (+5.72)#65 | 9.6% (+5.94)#2,455 |
| 66. | 72941 | 15.5% | 9.8% (+5.72)#66 | 9.6% (+5.94)#2,456 |
| 67. | 72538 | 15.5% | 9.8% (+5.69)#67 | 9.6% (+5.91)#2,470 |
| 68. | 72736 | 15.4% | 9.8% (+5.62)#68 | 9.6% (+5.84)#2,503 |
| 69. | 72099 | 15.4% | 9.8% (+5.56)#69 | 9.6% (+5.79)#2,527 |
| 70. | 72060 | 15.3% | 9.8% (+5.52)#70 | 9.6% (+5.75)#2,554 |
| 71. | 72022 | 15.2% | 9.8% (+5.34)#71 | 9.6% (+5.57)#2,640 |
| 72. | 72715 | 15.0% | 9.8% (+5.21)#72 | 9.6% (+5.44)#2,710 |
| 73. | 72571 | 14.9% | 9.8% (+5.13)#73 | 9.6% (+5.35)#2,774 |
| 74. | 72169 | 14.9% | 9.8% (+5.07)#74 | 9.6% (+5.30)#2,806 |
| 75. | 72854 | 14.8% | 9.8% (+4.99)#75 | 9.6% (+5.22)#2,856 |
| 76. | 72011 | 14.7% | 9.8% (+4.88)#76 | 9.6% (+5.11)#2,939 |
| 77. | 71960 | 14.7% | 9.8% (+4.86)#77 | 9.6% (+5.08)#2,957 |
| 78. | 72421 | 14.7% | 9.8% (+4.85)#78 | 9.6% (+5.08)#2,962 |
| 79. | 72473 | 14.6% | 9.8% (+4.75)#79 | 9.6% (+4.97)#3,035 |
| 80. | 72685 | 14.6% | 9.8% (+4.73)#80 | 9.6% (+4.96)#3,051 |
| 81. | 72758 | 14.4% | 9.8% (+4.61)#81 | 9.6% (+4.84)#3,131 |
| 82. | 72012 | 14.4% | 9.8% (+4.60)#82 | 9.6% (+4.83)#3,140 |
| 83. | 71764 | 14.3% | 9.8% (+4.47)#83 | 9.6% (+4.69)#3,246 |
| 84. | 72479 | 14.3% | 9.8% (+4.47)#84 | 9.6% (+4.69)#3,248 |
| 85. | 72427 | 14.3% | 9.8% (+4.47)#85 | 9.6% (+4.69)#3,277 |
| 86. | 71845 | 14.2% | 9.8% (+4.34)#86 | 9.6% (+4.56)#3,353 |
| 87. | 72564 | 14.1% | 9.8% (+4.30)#87 | 9.6% (+4.52)#3,381 |
| 88. | 71765 | 14.1% | 9.8% (+4.27)#88 | 9.6% (+4.50)#3,397 |
| 89. | 72865 | 14.1% | 9.8% (+4.25)#89 | 9.6% (+4.48)#3,415 |
| 90. | 72015 | 14.0% | 9.8% (+4.22)#90 | 9.6% (+4.45)#3,442 |
| 91. | 72084 | 14.0% | 9.8% (+4.22)#91 | 9.6% (+4.44)#3,443 |
| 92. | 72064 | 14.0% | 9.8% (+4.18)#92 | 9.6% (+4.40)#3,482 |
| 93. | 71958 | 13.9% | 9.8% (+4.08)#93 | 9.6% (+4.30)#3,563 |
| 94. | 72712 | 13.8% | 9.8% (+4.02)#94 | 9.6% (+4.25)#3,605 |
| 95. | 71933 | 13.8% | 9.8% (+3.97)#95 | 9.6% (+4.19)#3,660 |
| 96. | 71943 | 13.7% | 9.8% (+3.87)#96 | 9.6% (+4.10)#3,753 |
| 97. | 72045 | 13.7% | 9.8% (+3.83)#97 | 9.6% (+4.06)#3,792 |
| 98. | 72223 | 13.6% | 9.8% (+3.81)#98 | 9.6% (+4.04)#3,813 |
| 99. | 71665 | 13.5% | 9.8% (+3.68)#99 | 9.6% (+3.91)#3,937 |
| 100. | 72938 | 13.5% | 9.8% (+3.68)#100 | 9.6% (+3.91)#3,940 |
Common Questions
What are the Top 10 Zip Codes with the Highest Percentage of Population Employed in Sales & Related in Arkansas?
Top 10 Zip Codes with the Highest Percentage of Population Employed in Sales & Related in Arkansas are:
What zip code has the Highest Percentage of Population Employed in Sales & Related in Arkansas?
72478 has the Highest Percentage of Population Employed in Sales & Related in Arkansas with 51.6%.
What is the Percentage of Population Employed in Sales & Related in the State of Arkansas?
Percentage of Population Employed in Sales & Related in Arkansas is 9.8%.
What is the Percentage of Population Employed in Sales & Related in the United States?
Percentage of Population Employed in Sales & Related in the United States is 9.6%.