Zip Codes with the Highest Percentage of Population Employed in Sales & Related in Malibu, CA
RELATED REPORTS & OPTIONS
Sales & Related
Malibu
Compare Zip Codes
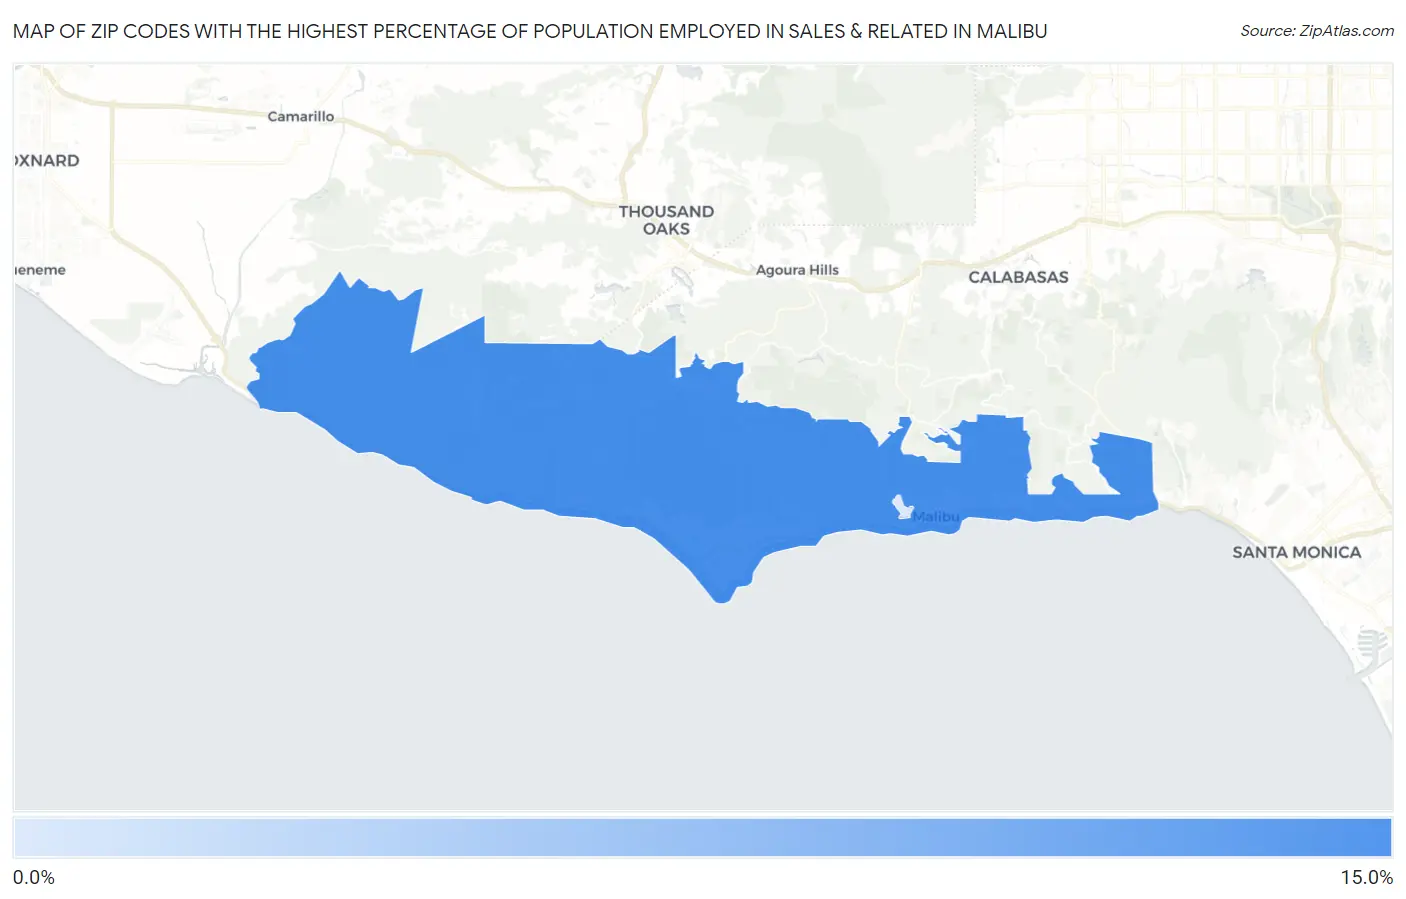
Map of Zip Codes with the Highest Percentage of Population Employed in Sales & Related in Malibu
2.4%
11.8%
Zip Codes with the Highest Percentage of Population Employed in Sales & Related in Malibu, CA
| Zip Code | % Employed | vs State | vs National | |
| 1. | 90265 | 11.8% | 9.4%(+2.32)#297 | 9.6%(+2.18)#6,453 |
| 2. | 90263 | 2.4% | 9.4%(-7.10)#1,546 | 9.6%(-7.24)#28,700 |
1
Common Questions
What are the Top Zip Codes with the Highest Percentage of Population Employed in Sales & Related in Malibu, CA?
Top Zip Codes with the Highest Percentage of Population Employed in Sales & Related in Malibu, CA are:
What zip code has the Highest Percentage of Population Employed in Sales & Related in Malibu, CA?
90265 has the Highest Percentage of Population Employed in Sales & Related in Malibu, CA with 11.8%.
What is the Percentage of Population Employed in Sales & Related in Malibu, CA?
Percentage of Population Employed in Sales & Related in Malibu is 13.4%.
What is the Percentage of Population Employed in Sales & Related in California?
Percentage of Population Employed in Sales & Related in California is 9.4%.
What is the Percentage of Population Employed in Sales & Related in the United States?
Percentage of Population Employed in Sales & Related in the United States is 9.6%.