Zip Codes with the Highest Percentage of Households with Income Below $10,000 in Tucson, AZ
RELATED REPORTS & OPTIONS
Household Income | $0-10k
Tucson
Compare Zip Codes
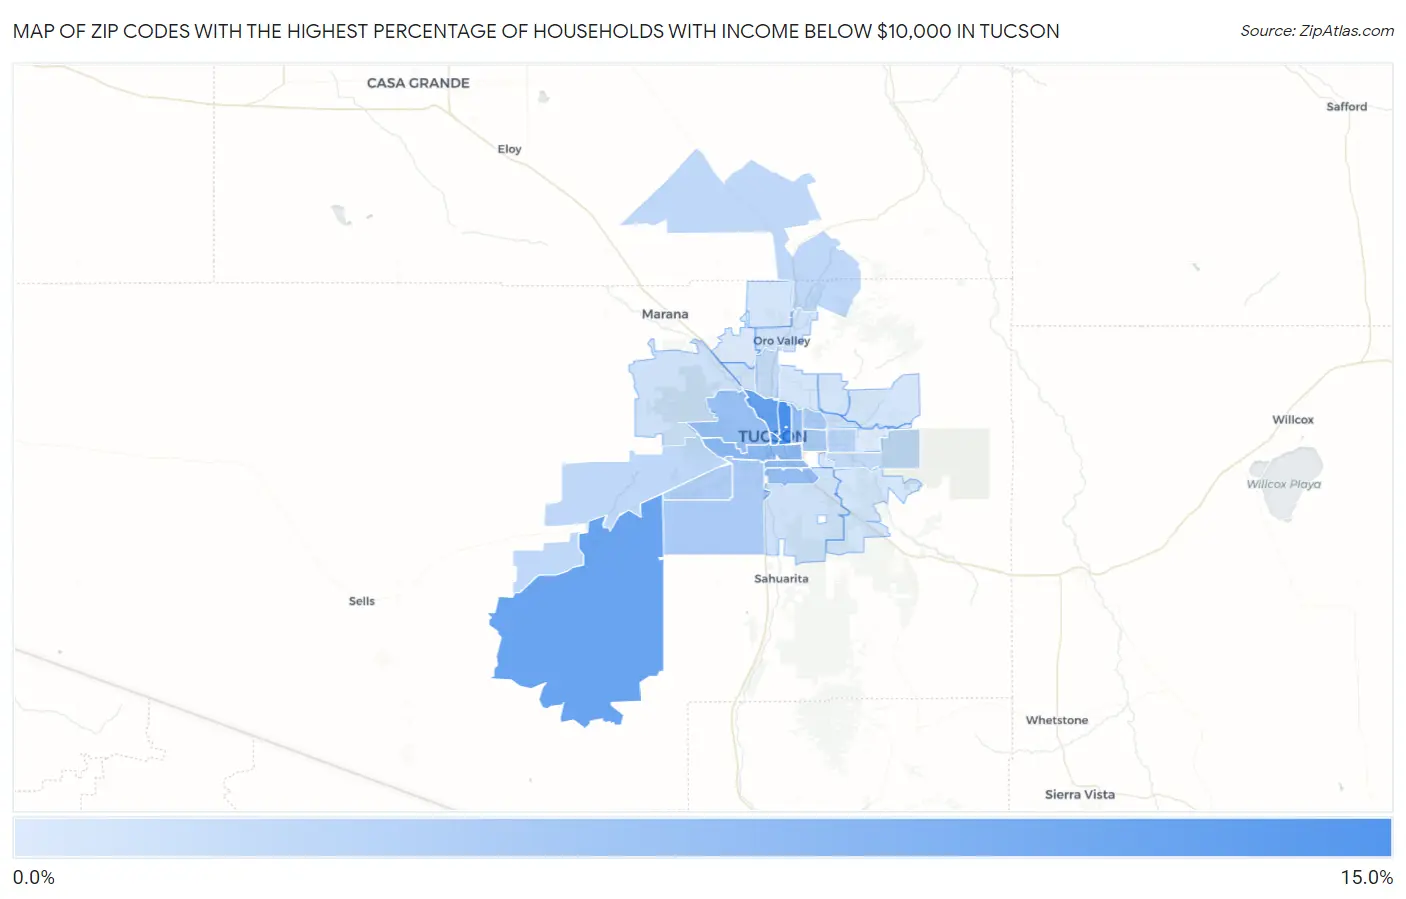
Map of Zip Codes with the Highest Percentage of Households with Income Below $10,000 in Tucson
2.4%
13.1%
Zip Codes with the Highest Percentage of Households with Income Below $10,000 in Tucson, AZ
| Zip Code | Households with Income < $10k | vs State | vs National | |
| 1. | 85719 | 13.1% | 4.9%(+8.20)#57 | 4.9%(+8.20)#2,020 |
| 2. | 85701 | 11.6% | 4.9%(+6.70)#66 | 4.9%(+6.70)#2,640 |
| 3. | 85705 | 10.8% | 4.9%(+5.90)#76 | 4.9%(+5.90)#3,053 |
| 4. | 85736 | 10.6% | 4.9%(+5.70)#83 | 4.9%(+5.70)#3,192 |
| 5. | 85713 | 8.0% | 4.9%(+3.10)#107 | 4.9%(+3.10)#5,544 |
| 6. | 85714 | 7.6% | 4.9%(+2.70)#115 | 4.9%(+2.70)#6,095 |
| 7. | 85706 | 7.5% | 4.9%(+2.60)#118 | 4.9%(+2.60)#6,191 |
| 8. | 85745 | 7.2% | 4.9%(+2.30)#124 | 4.9%(+2.30)#6,625 |
| 9. | 85716 | 7.2% | 4.9%(+2.30)#125 | 4.9%(+2.30)#6,633 |
| 10. | 85712 | 6.1% | 4.9%(+1.20)#146 | 4.9%(+1.20)#8,745 |
| 11. | 85711 | 6.0% | 4.9%(+1.10)#152 | 4.9%(+1.10)#8,970 |
| 12. | 85746 | 5.9% | 4.9%(+1.00)#160 | 4.9%(+1.00)#9,199 |
| 13. | 85757 | 5.5% | 4.9%(+0.600)#172 | 4.9%(+0.600)#10,247 |
| 14. | 85710 | 5.0% | 4.9%(+0.100)#195 | 4.9%(+0.100)#11,649 |
| 15. | 85739 | 4.4% | 4.9%(-0.500)#229 | 4.9%(-0.500)#13,750 |
| 16. | 85735 | 4.4% | 4.9%(-0.500)#230 | 4.9%(-0.500)#13,788 |
| 17. | 85704 | 4.2% | 4.9%(-0.700)#239 | 4.9%(-0.700)#14,475 |
| 18. | 85730 | 4.1% | 4.9%(-0.800)#246 | 4.9%(-0.800)#14,828 |
| 19. | 85715 | 3.8% | 4.9%(-1.10)#260 | 4.9%(-1.10)#16,075 |
| 20. | 85756 | 3.4% | 4.9%(-1.50)#276 | 4.9%(-1.50)#17,642 |
| 21. | 85741 | 3.3% | 4.9%(-1.60)#280 | 4.9%(-1.60)#18,082 |
| 22. | 85743 | 3.3% | 4.9%(-1.60)#281 | 4.9%(-1.60)#18,097 |
| 23. | 85737 | 3.2% | 4.9%(-1.70)#285 | 4.9%(-1.70)#18,548 |
| 24. | 85718 | 3.1% | 4.9%(-1.80)#290 | 4.9%(-1.80)#18,930 |
| 25. | 85747 | 3.0% | 4.9%(-1.90)#296 | 4.9%(-1.90)#19,377 |
| 26. | 85750 | 3.0% | 4.9%(-1.90)#297 | 4.9%(-1.90)#19,384 |
| 27. | 85755 | 3.0% | 4.9%(-1.90)#298 | 4.9%(-1.90)#19,422 |
| 28. | 85749 | 3.0% | 4.9%(-1.90)#299 | 4.9%(-1.90)#19,423 |
| 29. | 85708 | 2.7% | 4.9%(-2.20)#312 | 4.9%(-2.20)#20,869 |
| 30. | 85742 | 2.6% | 4.9%(-2.30)#314 | 4.9%(-2.30)#21,108 |
| 31. | 85748 | 2.4% | 4.9%(-2.50)#323 | 4.9%(-2.50)#22,066 |
1
Common Questions
What are the Top 10 Zip Codes with the Highest Percentage of Households with Income Below $10,000 in Tucson, AZ?
Top 10 Zip Codes with the Highest Percentage of Households with Income Below $10,000 in Tucson, AZ are:
What zip code has the Highest Percentage of Households with Income Below $10,000 in Tucson, AZ?
85719 has the Highest Percentage of Households with Income Below $10,000 in Tucson, AZ with 13.1%.
What is the Percentage of Households with Income Below $10,000 in Tucson, AZ?
Percentage of Households with Income Below $10,000 in Tucson is 7.1%.
What is the Percentage of Households with Income Below $10,000 in Arizona?
Percentage of Households with Income Below $10,000 in Arizona is 4.9%.
What is the Percentage of Households with Income Below $10,000 in the United States?
Percentage of Households with Income Below $10,000 in the United States is 4.9%.