Zip Codes with the Highest Percentage of Self-Employed / Not Incorporated in Tucson, AZ

RELATED REPORTS & OPTIONS

Self-Employed / Not Incorporated
Population
Families and Households
Female Fertility
Female Fertility (Unmarried)
Race (Community Size)
Race (Percentage)
Ancestry (Community Size)
AfghanAfricanAlaska NativeAlbanianAleutAlsatianAmericanApacheArabArgentineanArmenianAssyrian / Chaldean / SyriacAustralianAustrianBasqueBelgianBelizeanBhutaneseBlackfeetBolivianBrazilianBritishBulgarianBurmeseCajunCanadianCarpatho RusynCelticCentral AmericanCentral American IndianCherokeeCheyenneChickasawChileanChineseChippewaChoctawColombianComancheCosta RicanCreeCreekCroatianCubanCzechCzechoslovakianDanishDelawareDominicanDutchDutch West IndianEastern EuropeanEcuadorianEgyptianEnglishEstonianEthiopianEuropeanFilipinoFinnishFrenchFrench American IndianFrench CanadianGermanGerman RussianGhanaianGreekGuamanian / ChamorroGuatemalanGuyaneseHaitianHonduranHopiHungarianIcelanderIndian (Asian)IndonesianInupiatIranianIraqiIrishIroquoisIsraeliItalianJamaicanJapaneseJordanianKenyanKiowaKoreanLaotianLatvianLebaneseLithuanianLumbeeLuxembourgerMacedonianMalaysianMalteseMenomineeMexicanMexican American IndianMongolianMoroccanNative HawaiianNavajoNew ZealanderNicaraguanNigerianNorthern EuropeanNorwegianOsageOttawaPaiutePakistaniPalestinianPanamanianParaguayanPennsylvania GermanPeruvianPimaPolishPortuguesePotawatomiPuebloPuerto RicanPuget Sound SalishRomanianRussianSalvadoranSamoanScandinavianScotch-IrishScottishSeminoleSerbianShoshoneSiouxSlavicSlovakSloveneSomaliSouth AfricanSouth AmericanSouth American IndianSoviet UnionSpaniardSpanishSpanish AmericanSpanish American IndianSri LankanSubsaharan AfricanSudaneseSwedishSwissSyrianThaiTlingit-HaidaTohono O'OdhamTrinidadian and TobagonianTurkishU.S. Virgin IslanderUgandanUkrainianUteVenezuelanVietnameseWelshWest IndianYaquiYugoslavianYumanYup'ikZimbabwean
Ancestry (Percentage)
AfghanAfricanAlaska NativeAlbanianAleutAlsatianAmericanApacheArabArgentineanArmenianAssyrian / Chaldean / SyriacAustralianAustrianBasqueBelgianBelizeanBhutaneseBlackfeetBolivianBrazilianBritishBulgarianBurmeseCajunCanadianCarpatho RusynCelticCentral AmericanCentral American IndianCherokeeCheyenneChickasawChileanChineseChippewaChoctawColombianComancheCosta RicanCreeCreekCroatianCubanCzechCzechoslovakianDanishDelawareDominicanDutchDutch West IndianEastern EuropeanEcuadorianEgyptianEnglishEstonianEthiopianEuropeanFilipinoFinnishFrenchFrench American IndianFrench CanadianGermanGerman RussianGhanaianGreekGuamanian / ChamorroGuatemalanGuyaneseHaitianHonduranHopiHungarianIcelanderIndian (Asian)IndonesianInupiatIranianIraqiIrishIroquoisIsraeliItalianJamaicanJapaneseJordanianKenyanKiowaKoreanLaotianLatvianLebaneseLithuanianLumbeeLuxembourgerMacedonianMalaysianMalteseMenomineeMexicanMexican American IndianMongolianMoroccanNative HawaiianNavajoNew ZealanderNicaraguanNigerianNorthern EuropeanNorwegianOsageOttawaPaiutePakistaniPalestinianPanamanianParaguayanPennsylvania GermanPeruvianPimaPolishPortuguesePotawatomiPuebloPuerto RicanPuget Sound SalishRomanianRussianSalvadoranSamoanScandinavianScotch-IrishScottishSeminoleSerbianShoshoneSiouxSlavicSlovakSloveneSomaliSouth AfricanSouth AmericanSouth American IndianSoviet UnionSpaniardSpanishSpanish AmericanSpanish American IndianSri LankanSubsaharan AfricanSudaneseSwedishSwissSyrianThaiTlingit-HaidaTohono O'OdhamTrinidadian and TobagonianTurkishU.S. Virgin IslanderUgandanUkrainianUteVenezuelanVietnameseWelshWest IndianYaquiYugoslavianYumanYup'ikZimbabwean
Immigrant Origin (Total)
AfghanistanAfricaArgentinaArmeniaAsiaAustraliaAustriaBangladeshBelarusBelgiumBoliviaBosnia and HerzegovinaBrazilBulgariaBurma / MyanmarCameroonCanadaCaribbeanCentral AmericaChileChinaColombiaCongoCosta RicaCroatiaCubaCzechoslovakiaDenmarkDominican RepublicEastern AfricaEastern AsiaEastern EuropeEcuadorEgyptEl SalvadorEnglandEthiopiaEuropeFranceGermanyGhanaGreeceGrenadaGuatemalaGuyanaHaitiHondurasHong KongHungaryIndiaIndonesiaIranIraqIrelandIsraelItalyJamaicaJapanJordanKazakhstanKenyaKoreaKuwaitLaosLatin AmericaLebanonLiberiaLithuaniaMalaysiaMexicoMicronesiaMiddle AfricaMoldovaMoroccoNepalNetherlandsNicaraguaNigeriaNorth MacedoniaNorthern AfricaNorthern EuropeNorwayOceaniaPakistanPanamaPeruPhilippinesPolandPortugalRomaniaRussiaSaudi ArabiaScotlandSerbiaSingaporeSomaliaSouth AfricaSouth AmericaSouth Central AsiaSouth Eastern AsiaSouthern EuropeSpainSri LankaSudanSwedenSwitzerlandSyriaTaiwanThailandTrinidad and TobagoTurkeyUgandaUkraineUzbekistanVenezuelaVietnamWestern AfricaWestern AsiaWestern EuropeZaireZimbabwe
Immigrant Origin (Percentage)
AfghanistanAfricaArgentinaArmeniaAsiaAustraliaAustriaBangladeshBelarusBelgiumBoliviaBosnia and HerzegovinaBrazilBulgariaBurma / MyanmarCameroonCanadaCaribbeanCentral AmericaChileChinaColombiaCongoCosta RicaCroatiaCubaCzechoslovakiaDenmarkDominican RepublicEastern AfricaEastern AsiaEastern EuropeEcuadorEgyptEl SalvadorEnglandEthiopiaEuropeFranceGermanyGhanaGreeceGrenadaGuatemalaGuyanaHaitiHondurasHong KongHungaryIndiaIndonesiaIranIraqIrelandIsraelItalyJamaicaJapanJordanKazakhstanKenyaKoreaKuwaitLaosLatin AmericaLebanonLiberiaLithuaniaMalaysiaMexicoMicronesiaMiddle AfricaMoldovaMoroccoNepalNetherlandsNicaraguaNigeriaNorth MacedoniaNorthern AfricaNorthern EuropeNorwayOceaniaPakistanPanamaPeruPhilippinesPolandPortugalRomaniaRussiaSaudi ArabiaScotlandSerbiaSingaporeSomaliaSouth AfricaSouth AmericaSouth Central AsiaSouth Eastern AsiaSouthern EuropeSpainSri LankaSudanSwedenSwitzerlandSyriaTaiwanThailandTrinidad and TobagoTurkeyUgandaUkraineUzbekistanVenezuelaVietnamWestern AfricaWestern AsiaWestern EuropeZaireZimbabwe
Income
Income (Families)
Income (Households)
Poverty
Poverty (Families)
Unemployment
Employment Occupations
Employment Industries
Employer Class
Commute Time
Commute Means
School Enrollment
Education by Degree Field
Occupancy
Finances
Physical Characteristics
Tucson
Compare Zip Codes
Comparison Subject

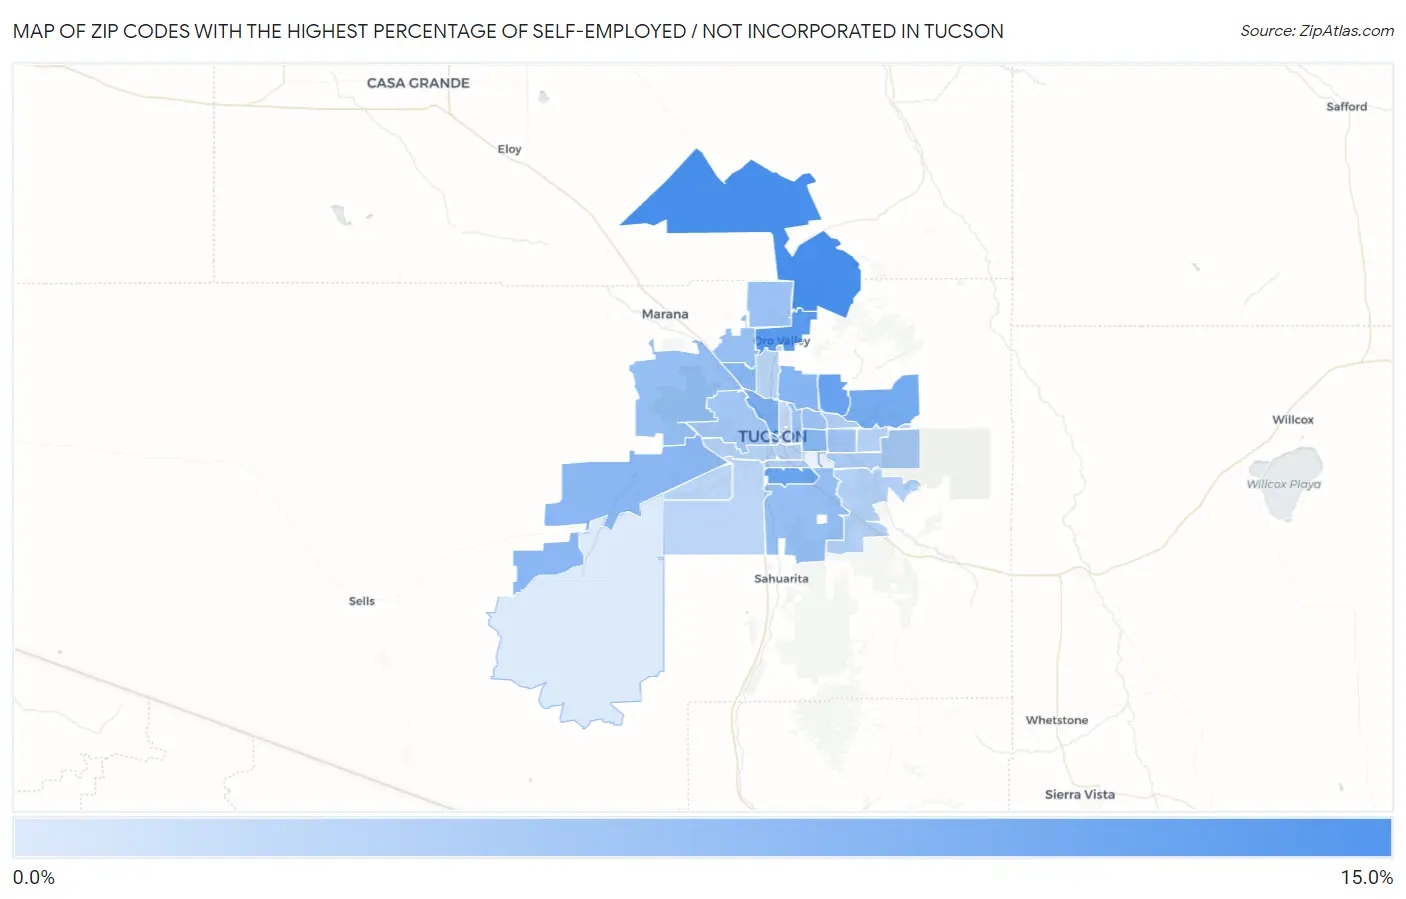
Map of Zip Codes with the Highest Percentage of Self-Employed / Not Incorporated in Tucson

0.0%
15.0%
Zip Codes with the Highest Percentage of Self-Employed / Not Incorporated in Tucson Map

Zip Codes with the Highest Percentage of Self-Employed / Not Incorporated in Tucson, AZ

Zip Code % Self-Employed / Not Incorporated vs State vs National
1.8573911.1%5.9%(+5.20)#445.8%(+5.24)#6,144
2.8573710.0%5.9%(+4.15)#525.8%(+4.19)#7,348
3.857509.0%5.9%(+3.10)#675.8%(+3.15)#8,837
4.857068.9%5.9%(+3.09)#695.8%(+3.13)#8,866
5.857498.3%5.9%(+2.42)#835.8%(+2.47)#10,090
6.857058.0%5.9%(+2.19)#895.8%(+2.23)#10,538
7.857187.3%5.9%(+1.39)#1285.8%(+1.44)#12,376
8.857417.2%5.9%(+1.36)#1295.8%(+1.41)#12,464
9.857117.1%5.9%(+1.28)#1315.8%(+1.32)#12,676
10.857357.1%5.9%(+1.23)#1325.8%(+1.27)#12,778
11.857566.3%5.9%(+0.452)#1605.8%(+0.496)#15,052
12.857436.3%5.9%(+0.452)#1615.8%(+0.496)#15,054
13.857426.3%5.9%(+0.412)#1645.8%(+0.456)#15,188
14.857126.1%5.9%(+0.212)#1755.8%(+0.256)#15,822
15.857556.0%5.9%(+0.166)#1785.8%(+0.210)#15,987
16.857165.9%5.9%(+0.062)#1845.8%(+0.106)#16,324
17.857105.8%5.9%(-0.036)#1885.8%(+0.008)#16,636
18.857015.7%5.9%(-0.129)#1935.8%(-0.085)#16,923
19.857455.6%5.9%(-0.263)#2015.8%(-0.219)#17,417
20.857305.2%5.9%(-0.698)#2295.8%(-0.654)#19,075
21.857144.9%5.9%(-0.915)#2405.8%(-0.871)#19,871
22.857154.9%5.9%(-0.950)#2415.8%(-0.906)#20,020
23.857474.6%5.9%(-1.22)#2555.8%(-1.18)#21,030
24.857134.5%5.9%(-1.41)#2625.8%(-1.36)#21,773
25.857484.4%5.9%(-1.41)#2635.8%(-1.37)#21,785
26.857044.2%5.9%(-1.62)#2725.8%(-1.58)#22,556
27.857464.1%5.9%(-1.75)#2785.8%(-1.71)#23,007
28.857574.1%5.9%(-1.79)#2815.8%(-1.75)#23,165
29.857193.8%5.9%(-2.03)#2955.8%(-1.98)#23,956
30.857362.3%5.9%(-3.60)#3315.8%(-3.55)#27,829

Common Questions

What are the Top 10 Zip Codes with the Highest Percentage of Self-Employed / Not Incorporated in Tucson, AZ?
Top 10 Zip Codes with the Highest Percentage of Self-Employed / Not Incorporated in Tucson, AZ are:
#1
11.1%
#2
10.0%
#3
9.0%
#4
8.9%
#5
8.3%
#6
8.0%
#7
7.3%
#8
7.2%
#9
7.1%
#10
7.1%
What zip code has the Highest Percentage of Self-Employed / Not Incorporated in Tucson, AZ?
85739 has the Highest Percentage of Self-Employed / Not Incorporated in Tucson, AZ with 11.1%.
What is the Percentage of Self-Employed / Not Incorporated in Tucson, AZ?
Percentage of Self-Employed / Not Incorporated in Tucson is 5.4%.
What is the Percentage of Self-Employed / Not Incorporated in Arizona?
Percentage of Self-Employed / Not Incorporated in Arizona is 5.9%.
What is the Percentage of Self-Employed / Not Incorporated in the United States?
Percentage of Self-Employed / Not Incorporated in the United States is 5.8%.