Zip Codes with the Highest Percentage of Population with a Degree in Science and Engineering in Tucson, AZ
RELATED REPORTS & OPTIONS
Science and Engineering
Tucson
Compare Zip Codes
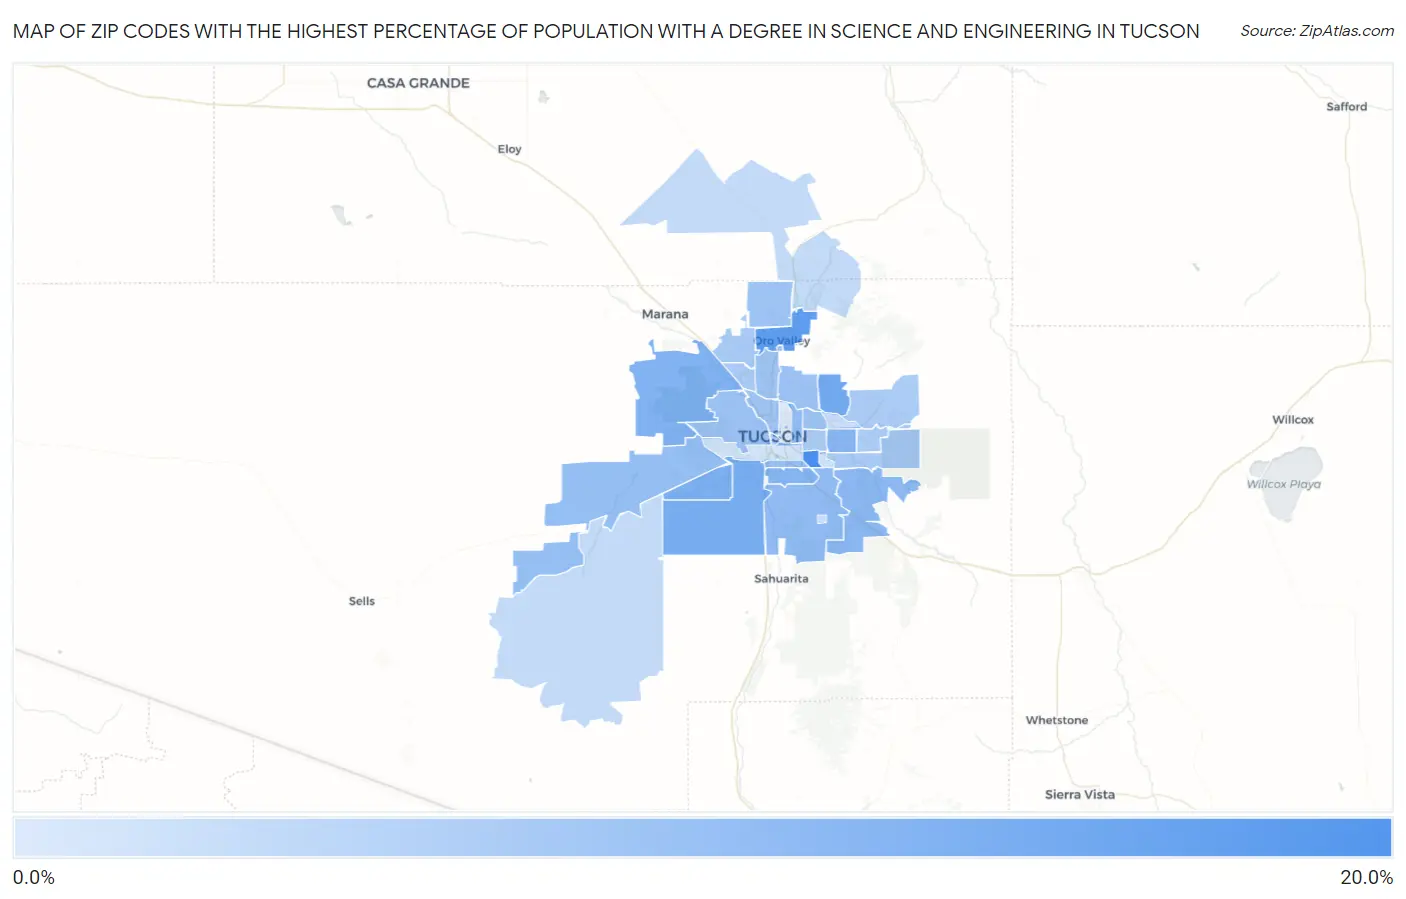
Map of Zip Codes with the Highest Percentage of Population with a Degree in Science and Engineering in Tucson
5.4%
17.8%

Zip Codes with the Highest Percentage of Population with a Degree in Science and Engineering in Tucson, AZ
| Zip Code | % Graduates | vs State | vs National | |
| 1. | 85707 | 17.8% | 10.2%(+7.59)#33 | 9.8%(+8.00)#4,438 |
| 2. | 85737 | 15.6% | 10.2%(+5.37)#45 | 9.8%(+5.78)#6,124 |
| 3. | 85750 | 13.9% | 10.2%(+3.74)#64 | 9.8%(+4.15)#7,938 |
| 4. | 85746 | 13.7% | 10.2%(+3.47)#69 | 9.8%(+3.88)#8,301 |
| 5. | 85757 | 13.3% | 10.2%(+3.15)#75 | 9.8%(+3.55)#8,712 |
| 6. | 85743 | 12.8% | 10.2%(+2.58)#90 | 9.8%(+2.98)#9,613 |
| 7. | 85706 | 12.5% | 10.2%(+2.28)#95 | 9.8%(+2.68)#10,109 |
| 8. | 85710 | 12.2% | 10.2%(+2.05)#98 | 9.8%(+2.46)#10,461 |
| 9. | 85747 | 11.9% | 10.2%(+1.72)#108 | 9.8%(+2.13)#11,063 |
| 10. | 85756 | 11.5% | 10.2%(+1.35)#119 | 9.8%(+1.76)#11,752 |
| 11. | 85716 | 11.4% | 10.2%(+1.22)#122 | 9.8%(+1.63)#12,008 |
| 12. | 85735 | 11.1% | 10.2%(+0.917)#130 | 9.8%(+1.32)#12,668 |
| 13. | 85714 | 10.9% | 10.2%(+0.761)#135 | 9.8%(+1.17)#12,984 |
| 14. | 85718 | 10.7% | 10.2%(+0.506)#145 | 9.8%(+0.912)#13,544 |
| 15. | 85712 | 10.6% | 10.2%(+0.438)#146 | 9.8%(+0.843)#13,692 |
| 16. | 85745 | 10.6% | 10.2%(+0.387)#148 | 9.8%(+0.793)#13,795 |
| 17. | 85755 | 10.5% | 10.2%(+0.270)#152 | 9.8%(+0.675)#14,057 |
| 18. | 85704 | 10.4% | 10.2%(+0.202)#157 | 9.8%(+0.607)#14,212 |
| 19. | 85705 | 10.2% | 10.2%(-0.033)#168 | 9.8%(+0.372)#14,695 |
| 20. | 85742 | 9.7% | 10.2%(-0.470)#186 | 9.8%(-0.064)#15,667 |
| 21. | 85741 | 9.5% | 10.2%(-0.703)#194 | 9.8%(-0.298)#16,206 |
| 22. | 85701 | 9.4% | 10.2%(-0.757)#195 | 9.8%(-0.352)#16,325 |
| 23. | 85730 | 9.4% | 10.2%(-0.829)#197 | 9.8%(-0.424)#16,491 |
| 24. | 85749 | 9.3% | 10.2%(-0.877)#201 | 9.8%(-0.471)#16,598 |
| 25. | 85748 | 9.3% | 10.2%(-0.909)#204 | 9.8%(-0.504)#16,689 |
| 26. | 85711 | 9.2% | 10.2%(-0.997)#205 | 9.8%(-0.592)#16,884 |
| 27. | 85739 | 7.4% | 10.2%(-2.78)#271 | 9.8%(-2.37)#20,925 |
| 28. | 85736 | 7.4% | 10.2%(-2.79)#273 | 9.8%(-2.38)#20,940 |
| 29. | 85734 | 7.1% | 10.2%(-3.04)#279 | 9.8%(-2.64)#21,434 |
| 30. | 85715 | 7.0% | 10.2%(-3.14)#280 | 9.8%(-2.74)#21,635 |
| 31. | 85708 | 6.5% | 10.2%(-3.74)#294 | 9.8%(-3.33)#22,659 |
| 32. | 85713 | 6.2% | 10.2%(-4.02)#303 | 9.8%(-3.62)#23,185 |
| 33. | 85719 | 5.4% | 10.2%(-4.78)#309 | 9.8%(-4.38)#24,233 |
1
Common Questions
What are the Top 10 Zip Codes with the Highest Percentage of Population with a Degree in Science and Engineering in Tucson, AZ?
Top 10 Zip Codes with the Highest Percentage of Population with a Degree in Science and Engineering in Tucson, AZ are:
What zip code has the Highest Percentage of Population with a Degree in Science and Engineering in Tucson, AZ?
85707 has the Highest Percentage of Population with a Degree in Science and Engineering in Tucson, AZ with 17.8%.
What is the Percentage of Population with a Degree in Science and Engineering in Tucson, AZ?
Percentage of Population with a Degree in Science and Engineering in Tucson is 9.7%.
What is the Percentage of Population with a Degree in Science and Engineering in Arizona?
Percentage of Population with a Degree in Science and Engineering in Arizona is 10.2%.
What is the Percentage of Population with a Degree in Science and Engineering in the United States?
Percentage of Population with a Degree in Science and Engineering in the United States is 9.8%.