Zip Codes with the Highest Percentage of Population Employed in Office & Administration in Tucson, AZ
RELATED REPORTS & OPTIONS
Office & Administration
Tucson
Compare Zip Codes
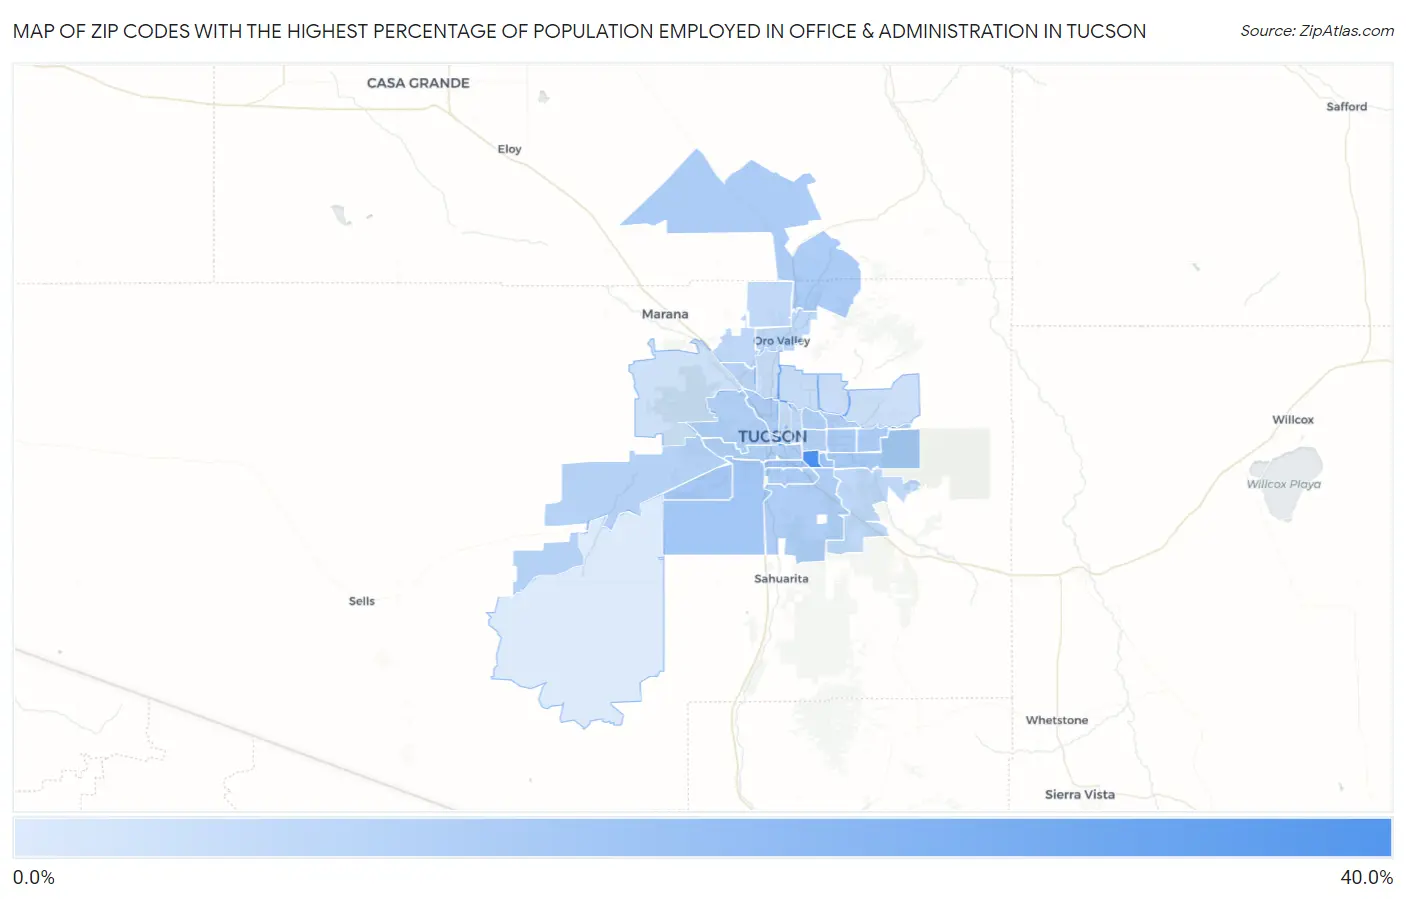
Map of Zip Codes with the Highest Percentage of Population Employed in Office & Administration in Tucson
4.8%
36.6%
Zip Codes with the Highest Percentage of Population Employed in Office & Administration in Tucson, AZ
| Zip Code | % Employed | vs State | vs National | |
| 1. | 85707 | 36.6% | 12.6%(+24.0)#4 | 10.9%(+25.7)#344 |
| 2. | 85708 | 18.1% | 12.6%(+5.47)#41 | 10.9%(+7.21)#2,317 |
| 3. | 85714 | 17.6% | 12.6%(+5.03)#45 | 10.9%(+6.76)#2,527 |
| 4. | 85746 | 16.2% | 12.6%(+3.60)#64 | 10.9%(+5.33)#3,406 |
| 5. | 85757 | 15.8% | 12.6%(+3.17)#71 | 10.9%(+4.90)#3,769 |
| 6. | 85730 | 15.0% | 12.6%(+2.37)#91 | 10.9%(+4.10)#4,606 |
| 7. | 85710 | 14.8% | 12.6%(+2.16)#98 | 10.9%(+3.89)#4,903 |
| 8. | 85739 | 14.4% | 12.6%(+1.81)#111 | 10.9%(+3.55)#5,399 |
| 9. | 85705 | 14.2% | 12.6%(+1.60)#118 | 10.9%(+3.34)#5,708 |
| 10. | 85706 | 14.1% | 12.6%(+1.48)#119 | 10.9%(+3.21)#5,892 |
| 11. | 85748 | 14.1% | 12.6%(+1.48)#120 | 10.9%(+3.21)#5,902 |
| 12. | 85756 | 13.6% | 12.6%(+1.03)#134 | 10.9%(+2.77)#6,678 |
| 13. | 85745 | 13.4% | 12.6%(+0.793)#144 | 10.9%(+2.53)#7,183 |
| 14. | 85713 | 13.2% | 12.6%(+0.590)#152 | 10.9%(+2.32)#7,630 |
| 15. | 85715 | 13.1% | 12.6%(+0.538)#153 | 10.9%(+2.27)#7,757 |
| 16. | 85712 | 13.1% | 12.6%(+0.522)#154 | 10.9%(+2.25)#7,797 |
| 17. | 85711 | 12.5% | 12.6%(-0.089)#178 | 10.9%(+1.64)#9,250 |
| 18. | 85735 | 12.4% | 12.6%(-0.206)#185 | 10.9%(+1.53)#9,609 |
| 19. | 85741 | 11.8% | 12.6%(-0.838)#210 | 10.9%(+0.895)#11,477 |
| 20. | 85747 | 10.6% | 12.6%(-2.02)#252 | 10.9%(-0.286)#15,233 |
| 21. | 85716 | 10.6% | 12.6%(-2.03)#255 | 10.9%(-0.299)#15,275 |
| 22. | 85742 | 10.5% | 12.6%(-2.07)#258 | 10.9%(-0.339)#15,416 |
| 23. | 85737 | 10.5% | 12.6%(-2.09)#260 | 10.9%(-0.360)#15,498 |
| 24. | 85755 | 10.1% | 12.6%(-2.52)#273 | 10.9%(-0.785)#16,899 |
| 25. | 85719 | 9.4% | 12.6%(-3.23)#289 | 10.9%(-1.50)#19,226 |
| 26. | 85718 | 9.0% | 12.6%(-3.59)#294 | 10.9%(-1.85)#20,247 |
| 27. | 85704 | 9.0% | 12.6%(-3.62)#297 | 10.9%(-1.88)#20,338 |
| 28. | 85750 | 8.1% | 12.6%(-4.46)#312 | 10.9%(-2.73)#22,716 |
| 29. | 85701 | 8.1% | 12.6%(-4.47)#313 | 10.9%(-2.74)#22,741 |
| 30. | 85749 | 8.1% | 12.6%(-4.53)#315 | 10.9%(-2.79)#22,874 |
| 31. | 85743 | 7.6% | 12.6%(-5.02)#324 | 10.9%(-3.28)#23,992 |
| 32. | 85736 | 4.8% | 12.6%(-7.74)#351 | 10.9%(-6.01)#28,236 |
1
Common Questions
What are the Top 10 Zip Codes with the Highest Percentage of Population Employed in Office & Administration in Tucson, AZ?
Top 10 Zip Codes with the Highest Percentage of Population Employed in Office & Administration in Tucson, AZ are:
What zip code has the Highest Percentage of Population Employed in Office & Administration in Tucson, AZ?
85707 has the Highest Percentage of Population Employed in Office & Administration in Tucson, AZ with 36.6%.
What is the Percentage of Population Employed in Office & Administration in Tucson, AZ?
Percentage of Population Employed in Office & Administration in Tucson is 13.2%.
What is the Percentage of Population Employed in Office & Administration in Arizona?
Percentage of Population Employed in Office & Administration in Arizona is 12.6%.
What is the Percentage of Population Employed in Office & Administration in the United States?
Percentage of Population Employed in Office & Administration in the United States is 10.9%.