Zip Codes with the Lowest Poverty Level Among Single Mothers in Tucson, AZ

RELATED REPORTS & OPTIONS

Lowest Poverty | Single Mother
Population
Families and Households
Female Fertility
Female Fertility (Unmarried)
Race (Community Size)
Race (Percentage)
Ancestry (Community Size)
AfghanAfricanAlaska NativeAlbanianAleutAlsatianAmericanApacheArabArgentineanArmenianAssyrian / Chaldean / SyriacAustralianAustrianBasqueBelgianBelizeanBhutaneseBlackfeetBolivianBrazilianBritishBulgarianBurmeseCajunCanadianCarpatho RusynCelticCentral AmericanCentral American IndianCherokeeCheyenneChickasawChileanChineseChippewaChoctawColombianComancheCosta RicanCreeCreekCroatianCubanCzechCzechoslovakianDanishDelawareDominicanDutchDutch West IndianEastern EuropeanEcuadorianEgyptianEnglishEstonianEthiopianEuropeanFilipinoFinnishFrenchFrench American IndianFrench CanadianGermanGerman RussianGhanaianGreekGuamanian / ChamorroGuatemalanGuyaneseHaitianHonduranHopiHungarianIcelanderIndian (Asian)IndonesianInupiatIranianIraqiIrishIroquoisIsraeliItalianJamaicanJapaneseJordanianKenyanKiowaKoreanLaotianLatvianLebaneseLithuanianLumbeeLuxembourgerMacedonianMalaysianMalteseMenomineeMexicanMexican American IndianMongolianMoroccanNative HawaiianNavajoNew ZealanderNicaraguanNigerianNorthern EuropeanNorwegianOsageOttawaPaiutePakistaniPalestinianPanamanianParaguayanPennsylvania GermanPeruvianPimaPolishPortuguesePotawatomiPuebloPuerto RicanPuget Sound SalishRomanianRussianSalvadoranSamoanScandinavianScotch-IrishScottishSeminoleSerbianShoshoneSiouxSlavicSlovakSloveneSomaliSouth AfricanSouth AmericanSouth American IndianSoviet UnionSpaniardSpanishSpanish AmericanSpanish American IndianSri LankanSubsaharan AfricanSudaneseSwedishSwissSyrianThaiTlingit-HaidaTohono O'OdhamTrinidadian and TobagonianTurkishU.S. Virgin IslanderUgandanUkrainianUteVenezuelanVietnameseWelshWest IndianYaquiYugoslavianYumanYup'ikZimbabwean
Ancestry (Percentage)
AfghanAfricanAlaska NativeAlbanianAleutAlsatianAmericanApacheArabArgentineanArmenianAssyrian / Chaldean / SyriacAustralianAustrianBasqueBelgianBelizeanBhutaneseBlackfeetBolivianBrazilianBritishBulgarianBurmeseCajunCanadianCarpatho RusynCelticCentral AmericanCentral American IndianCherokeeCheyenneChickasawChileanChineseChippewaChoctawColombianComancheCosta RicanCreeCreekCroatianCubanCzechCzechoslovakianDanishDelawareDominicanDutchDutch West IndianEastern EuropeanEcuadorianEgyptianEnglishEstonianEthiopianEuropeanFilipinoFinnishFrenchFrench American IndianFrench CanadianGermanGerman RussianGhanaianGreekGuamanian / ChamorroGuatemalanGuyaneseHaitianHonduranHopiHungarianIcelanderIndian (Asian)IndonesianInupiatIranianIraqiIrishIroquoisIsraeliItalianJamaicanJapaneseJordanianKenyanKiowaKoreanLaotianLatvianLebaneseLithuanianLumbeeLuxembourgerMacedonianMalaysianMalteseMenomineeMexicanMexican American IndianMongolianMoroccanNative HawaiianNavajoNew ZealanderNicaraguanNigerianNorthern EuropeanNorwegianOsageOttawaPaiutePakistaniPalestinianPanamanianParaguayanPennsylvania GermanPeruvianPimaPolishPortuguesePotawatomiPuebloPuerto RicanPuget Sound SalishRomanianRussianSalvadoranSamoanScandinavianScotch-IrishScottishSeminoleSerbianShoshoneSiouxSlavicSlovakSloveneSomaliSouth AfricanSouth AmericanSouth American IndianSoviet UnionSpaniardSpanishSpanish AmericanSpanish American IndianSri LankanSubsaharan AfricanSudaneseSwedishSwissSyrianThaiTlingit-HaidaTohono O'OdhamTrinidadian and TobagonianTurkishU.S. Virgin IslanderUgandanUkrainianUteVenezuelanVietnameseWelshWest IndianYaquiYugoslavianYumanYup'ikZimbabwean
Immigrant Origin (Total)
AfghanistanAfricaArgentinaArmeniaAsiaAustraliaAustriaBangladeshBelarusBelgiumBoliviaBosnia and HerzegovinaBrazilBulgariaBurma / MyanmarCameroonCanadaCaribbeanCentral AmericaChileChinaColombiaCongoCosta RicaCroatiaCubaCzechoslovakiaDenmarkDominican RepublicEastern AfricaEastern AsiaEastern EuropeEcuadorEgyptEl SalvadorEnglandEthiopiaEuropeFranceGermanyGhanaGreeceGrenadaGuatemalaGuyanaHaitiHondurasHong KongHungaryIndiaIndonesiaIranIraqIrelandIsraelItalyJamaicaJapanJordanKazakhstanKenyaKoreaKuwaitLaosLatin AmericaLebanonLiberiaLithuaniaMalaysiaMexicoMicronesiaMiddle AfricaMoldovaMoroccoNepalNetherlandsNicaraguaNigeriaNorth MacedoniaNorthern AfricaNorthern EuropeNorwayOceaniaPakistanPanamaPeruPhilippinesPolandPortugalRomaniaRussiaSaudi ArabiaScotlandSerbiaSingaporeSomaliaSouth AfricaSouth AmericaSouth Central AsiaSouth Eastern AsiaSouthern EuropeSpainSri LankaSudanSwedenSwitzerlandSyriaTaiwanThailandTrinidad and TobagoTurkeyUgandaUkraineUzbekistanVenezuelaVietnamWestern AfricaWestern AsiaWestern EuropeZaireZimbabwe
Immigrant Origin (Percentage)
AfghanistanAfricaArgentinaArmeniaAsiaAustraliaAustriaBangladeshBelarusBelgiumBoliviaBosnia and HerzegovinaBrazilBulgariaBurma / MyanmarCameroonCanadaCaribbeanCentral AmericaChileChinaColombiaCongoCosta RicaCroatiaCubaCzechoslovakiaDenmarkDominican RepublicEastern AfricaEastern AsiaEastern EuropeEcuadorEgyptEl SalvadorEnglandEthiopiaEuropeFranceGermanyGhanaGreeceGrenadaGuatemalaGuyanaHaitiHondurasHong KongHungaryIndiaIndonesiaIranIraqIrelandIsraelItalyJamaicaJapanJordanKazakhstanKenyaKoreaKuwaitLaosLatin AmericaLebanonLiberiaLithuaniaMalaysiaMexicoMicronesiaMiddle AfricaMoldovaMoroccoNepalNetherlandsNicaraguaNigeriaNorth MacedoniaNorthern AfricaNorthern EuropeNorwayOceaniaPakistanPanamaPeruPhilippinesPolandPortugalRomaniaRussiaSaudi ArabiaScotlandSerbiaSingaporeSomaliaSouth AfricaSouth AmericaSouth Central AsiaSouth Eastern AsiaSouthern EuropeSpainSri LankaSudanSwedenSwitzerlandSyriaTaiwanThailandTrinidad and TobagoTurkeyUgandaUkraineUzbekistanVenezuelaVietnamWestern AfricaWestern AsiaWestern EuropeZaireZimbabwe
Income
Income (Families)
Income (Households)
Poverty
Poverty (Families)
Unemployment
Employment Occupations
Employment Industries
Employer Class
Commute Time
Commute Means
School Enrollment
Education by Degree Field
Occupancy
Finances
Physical Characteristics
Tucson
Compare Zip Codes
Comparison Subject

Map of Zip Codes with the Lowest Poverty Level Among Single Mothers in Tucson

54.9%
6.4%
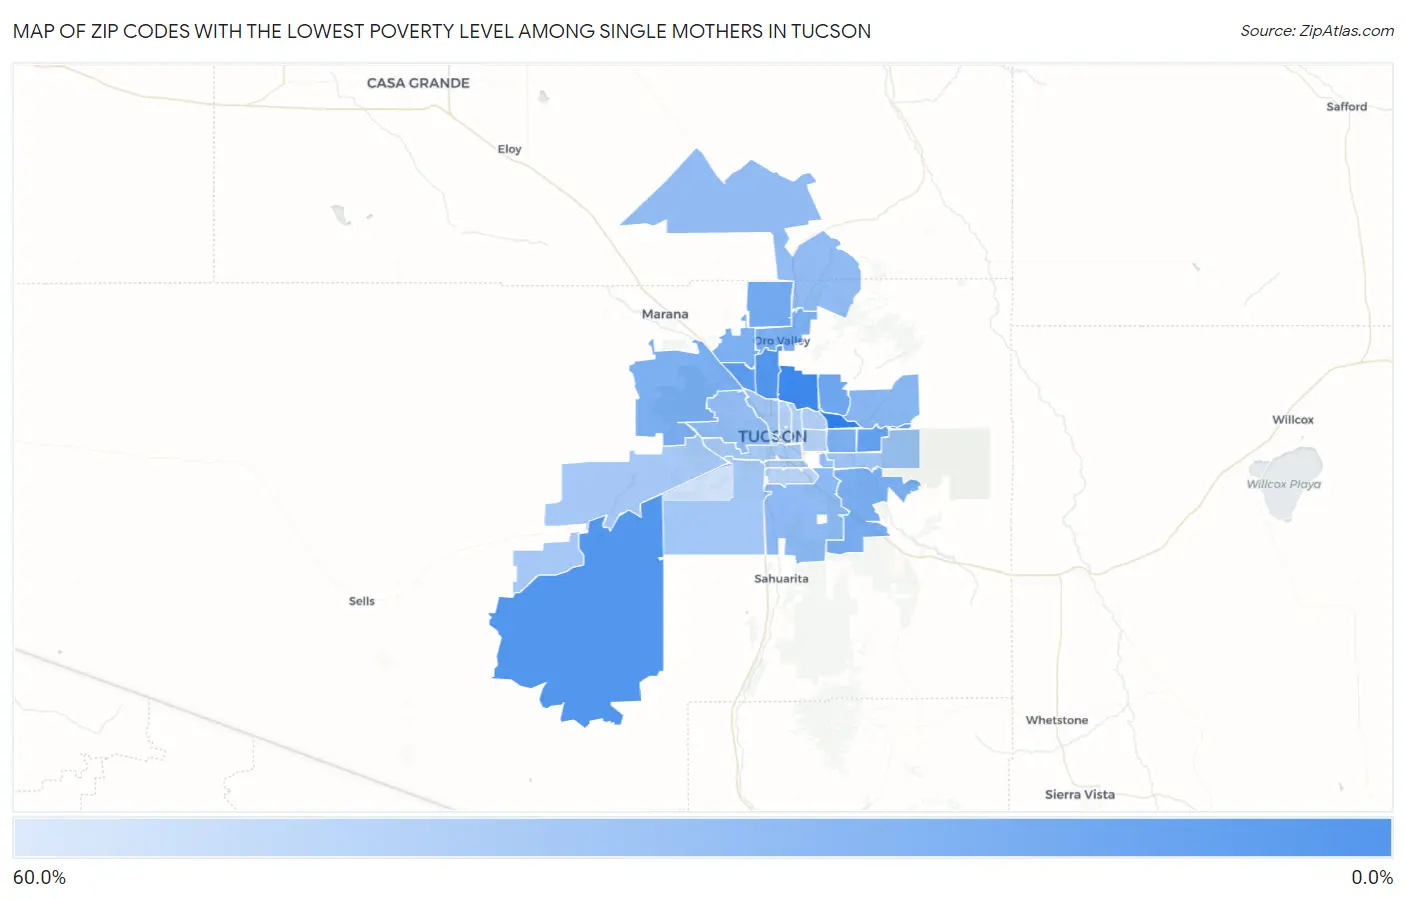
Zip Codes with the Lowest Poverty Level Among Single Mothers in Tucson Map

Zip Codes with the Lowest Poverty Level Among Single Mothers in Tucson, AZ

Zip Code Single Mother Poverty vs State vs National
1. 85718 6.4% 31.3% (-24.9)#7 33.1% (-26.7)#781
2. 85736 12.9% 31.3% (-18.4)#23 33.1% (-20.3)#2,551
3. 85704 12.9% 31.3% (-18.4)#24 33.1% (-20.3)#2,556
4. 85741 16.3% 31.3% (-15.0)#40 33.1% (-16.9)#3,752
5. 85748 17.4% 31.3% (-13.9)#49 33.1% (-15.7)#4,169
6. 85750 20.7% 31.3% (-10.5)#64 33.1% (-12.4)#5,507
7. 85755 22.2% 31.3% (-9.05)#71 33.1% (-10.9)#6,069
8. 85747 24.3% 31.3% (-7.00)#89 33.1% (-8.86)#6,891
9. 85737 25.1% 31.3% (-6.20)#96 33.1% (-8.06)#7,299
10. 85742 25.6% 31.3% (-5.64)#100 33.1% (-7.50)#7,479
11. 85710 25.8% 31.3% (-5.47)#101 33.1% (-7.33)#7,536
12. 85743 25.9% 31.3% (-5.36)#102 33.1% (-7.23)#7,579
13. 85749 28.6% 31.3% (-2.70)#124 33.1% (-4.56)#8,579
14. 85756 31.2% 31.3% (-0.066)#138 33.1% (-1.93)#9,648
15. 85745 31.5% 31.3% (+0.188)#142 33.1% (-1.68)#9,756
16. 85739 32.1% 31.3% (+0.806)#143 33.1% (-1.06)#10,001
17. 85708 33.6% 31.3% (+2.38)#151 33.1% (+0.509)#10,742
18. 85705 36.2% 31.3% (+4.96)#164 33.1% (+3.09)#11,685
19. 85730 36.7% 31.3% (+5.43)#166 33.1% (+3.57)#11,883
20. 85746 37.8% 31.3% (+6.50)#174 33.1% (+4.63)#12,310
21. 85735 38.5% 31.3% (+7.19)#176 33.1% (+5.33)#12,531
22. 85714 39.1% 31.3% (+7.80)#178 33.1% (+5.94)#12,754
23. 85713 39.9% 31.3% (+8.59)#181 33.1% (+6.73)#13,029
24. 85712 42.5% 31.3% (+11.2)#200 33.1% (+9.37)#13,965
25. 85716 43.6% 31.3% (+12.3)#206 33.1% (+10.4)#14,291
26. 85719 43.7% 31.3% (+12.4)#207 33.1% (+10.6)#14,322
27. 85711 44.7% 31.3% (+13.5)#214 33.1% (+11.6)#14,643
28. 85706 45.6% 31.3% (+14.3)#221 33.1% (+12.4)#14,902
29. 85701 53.3% 31.3% (+22.0)#245 33.1% (+20.1)#17,049
30. 85757 54.9% 31.3% (+23.6)#248 33.1% (+21.7)#17,390

Common Questions

What are the Top 10 Zip Codes with the Lowest Poverty Level Among Single Mothers in Tucson, AZ?
Top 10 Zip Codes with the Lowest Poverty Level Among Single Mothers in Tucson, AZ are:
#1
0.0%
#2
6.4%
#3
12.9%
#4
12.9%
#5
16.3%
#6
17.4%
#7
20.7%
#8
22.2%
#9
24.3%
#10
25.1%
What zip code has the Lowest Poverty Level Among Single Mothers in Tucson, AZ?
85718 has the Lowest Poverty Level Among Single Mothers in Tucson, AZ with 6.4%.
What is the Poverty Level Among Single Mothers in Tucson, AZ?
Poverty Level Among Single Mothers in Tucson is 37.7%.
What is the Poverty Level Among Single Mothers in Arizona?
Poverty Level Among Single Mothers in Arizona is 31.3%.
What is the Poverty Level Among Single Mothers in the United States?
Poverty Level Among Single Mothers in the United States is 33.1%.