Zip Codes with the Highest Percentage of Self-Employed / Incorporated in Tucson, AZ

RELATED REPORTS & OPTIONS

Self-Employed / Incorporated
Population
Families and Households
Female Fertility
Female Fertility (Unmarried)
Race (Community Size)
Race (Percentage)
Ancestry (Community Size)
AfghanAfricanAlaska NativeAlbanianAleutAlsatianAmericanApacheArabArgentineanArmenianAssyrian / Chaldean / SyriacAustralianAustrianBasqueBelgianBelizeanBhutaneseBlackfeetBolivianBrazilianBritishBulgarianBurmeseCajunCanadianCarpatho RusynCelticCentral AmericanCentral American IndianCherokeeCheyenneChickasawChileanChineseChippewaChoctawColombianComancheCosta RicanCreeCreekCroatianCubanCzechCzechoslovakianDanishDelawareDominicanDutchDutch West IndianEastern EuropeanEcuadorianEgyptianEnglishEstonianEthiopianEuropeanFilipinoFinnishFrenchFrench American IndianFrench CanadianGermanGerman RussianGhanaianGreekGuamanian / ChamorroGuatemalanGuyaneseHaitianHonduranHopiHungarianIcelanderIndian (Asian)IndonesianInupiatIranianIraqiIrishIroquoisIsraeliItalianJamaicanJapaneseJordanianKenyanKiowaKoreanLaotianLatvianLebaneseLithuanianLumbeeLuxembourgerMacedonianMalaysianMalteseMenomineeMexicanMexican American IndianMongolianMoroccanNative HawaiianNavajoNew ZealanderNicaraguanNigerianNorthern EuropeanNorwegianOsageOttawaPaiutePakistaniPalestinianPanamanianParaguayanPennsylvania GermanPeruvianPimaPolishPortuguesePotawatomiPuebloPuerto RicanPuget Sound SalishRomanianRussianSalvadoranSamoanScandinavianScotch-IrishScottishSeminoleSerbianShoshoneSiouxSlavicSlovakSloveneSomaliSouth AfricanSouth AmericanSouth American IndianSoviet UnionSpaniardSpanishSpanish AmericanSpanish American IndianSri LankanSubsaharan AfricanSudaneseSwedishSwissSyrianThaiTlingit-HaidaTohono O'OdhamTrinidadian and TobagonianTurkishU.S. Virgin IslanderUgandanUkrainianUteVenezuelanVietnameseWelshWest IndianYaquiYugoslavianYumanYup'ikZimbabwean
Ancestry (Percentage)
AfghanAfricanAlaska NativeAlbanianAleutAlsatianAmericanApacheArabArgentineanArmenianAssyrian / Chaldean / SyriacAustralianAustrianBasqueBelgianBelizeanBhutaneseBlackfeetBolivianBrazilianBritishBulgarianBurmeseCajunCanadianCarpatho RusynCelticCentral AmericanCentral American IndianCherokeeCheyenneChickasawChileanChineseChippewaChoctawColombianComancheCosta RicanCreeCreekCroatianCubanCzechCzechoslovakianDanishDelawareDominicanDutchDutch West IndianEastern EuropeanEcuadorianEgyptianEnglishEstonianEthiopianEuropeanFilipinoFinnishFrenchFrench American IndianFrench CanadianGermanGerman RussianGhanaianGreekGuamanian / ChamorroGuatemalanGuyaneseHaitianHonduranHopiHungarianIcelanderIndian (Asian)IndonesianInupiatIranianIraqiIrishIroquoisIsraeliItalianJamaicanJapaneseJordanianKenyanKiowaKoreanLaotianLatvianLebaneseLithuanianLumbeeLuxembourgerMacedonianMalaysianMalteseMenomineeMexicanMexican American IndianMongolianMoroccanNative HawaiianNavajoNew ZealanderNicaraguanNigerianNorthern EuropeanNorwegianOsageOttawaPaiutePakistaniPalestinianPanamanianParaguayanPennsylvania GermanPeruvianPimaPolishPortuguesePotawatomiPuebloPuerto RicanPuget Sound SalishRomanianRussianSalvadoranSamoanScandinavianScotch-IrishScottishSeminoleSerbianShoshoneSiouxSlavicSlovakSloveneSomaliSouth AfricanSouth AmericanSouth American IndianSoviet UnionSpaniardSpanishSpanish AmericanSpanish American IndianSri LankanSubsaharan AfricanSudaneseSwedishSwissSyrianThaiTlingit-HaidaTohono O'OdhamTrinidadian and TobagonianTurkishU.S. Virgin IslanderUgandanUkrainianUteVenezuelanVietnameseWelshWest IndianYaquiYugoslavianYumanYup'ikZimbabwean
Immigrant Origin (Total)
AfghanistanAfricaArgentinaArmeniaAsiaAustraliaAustriaBangladeshBelarusBelgiumBoliviaBosnia and HerzegovinaBrazilBulgariaBurma / MyanmarCameroonCanadaCaribbeanCentral AmericaChileChinaColombiaCongoCosta RicaCroatiaCubaCzechoslovakiaDenmarkDominican RepublicEastern AfricaEastern AsiaEastern EuropeEcuadorEgyptEl SalvadorEnglandEthiopiaEuropeFranceGermanyGhanaGreeceGrenadaGuatemalaGuyanaHaitiHondurasHong KongHungaryIndiaIndonesiaIranIraqIrelandIsraelItalyJamaicaJapanJordanKazakhstanKenyaKoreaKuwaitLaosLatin AmericaLebanonLiberiaLithuaniaMalaysiaMexicoMicronesiaMiddle AfricaMoldovaMoroccoNepalNetherlandsNicaraguaNigeriaNorth MacedoniaNorthern AfricaNorthern EuropeNorwayOceaniaPakistanPanamaPeruPhilippinesPolandPortugalRomaniaRussiaSaudi ArabiaScotlandSerbiaSingaporeSomaliaSouth AfricaSouth AmericaSouth Central AsiaSouth Eastern AsiaSouthern EuropeSpainSri LankaSudanSwedenSwitzerlandSyriaTaiwanThailandTrinidad and TobagoTurkeyUgandaUkraineUzbekistanVenezuelaVietnamWestern AfricaWestern AsiaWestern EuropeZaireZimbabwe
Immigrant Origin (Percentage)
AfghanistanAfricaArgentinaArmeniaAsiaAustraliaAustriaBangladeshBelarusBelgiumBoliviaBosnia and HerzegovinaBrazilBulgariaBurma / MyanmarCameroonCanadaCaribbeanCentral AmericaChileChinaColombiaCongoCosta RicaCroatiaCubaCzechoslovakiaDenmarkDominican RepublicEastern AfricaEastern AsiaEastern EuropeEcuadorEgyptEl SalvadorEnglandEthiopiaEuropeFranceGermanyGhanaGreeceGrenadaGuatemalaGuyanaHaitiHondurasHong KongHungaryIndiaIndonesiaIranIraqIrelandIsraelItalyJamaicaJapanJordanKazakhstanKenyaKoreaKuwaitLaosLatin AmericaLebanonLiberiaLithuaniaMalaysiaMexicoMicronesiaMiddle AfricaMoldovaMoroccoNepalNetherlandsNicaraguaNigeriaNorth MacedoniaNorthern AfricaNorthern EuropeNorwayOceaniaPakistanPanamaPeruPhilippinesPolandPortugalRomaniaRussiaSaudi ArabiaScotlandSerbiaSingaporeSomaliaSouth AfricaSouth AmericaSouth Central AsiaSouth Eastern AsiaSouthern EuropeSpainSri LankaSudanSwedenSwitzerlandSyriaTaiwanThailandTrinidad and TobagoTurkeyUgandaUkraineUzbekistanVenezuelaVietnamWestern AfricaWestern AsiaWestern EuropeZaireZimbabwe
Income
Income (Families)
Income (Households)
Poverty
Poverty (Families)
Unemployment
Employment Occupations
Employment Industries
Employer Class
Commute Time
Commute Means
School Enrollment
Education by Degree Field
Occupancy
Finances
Physical Characteristics
Tucson
Compare Zip Codes
Comparison Subject

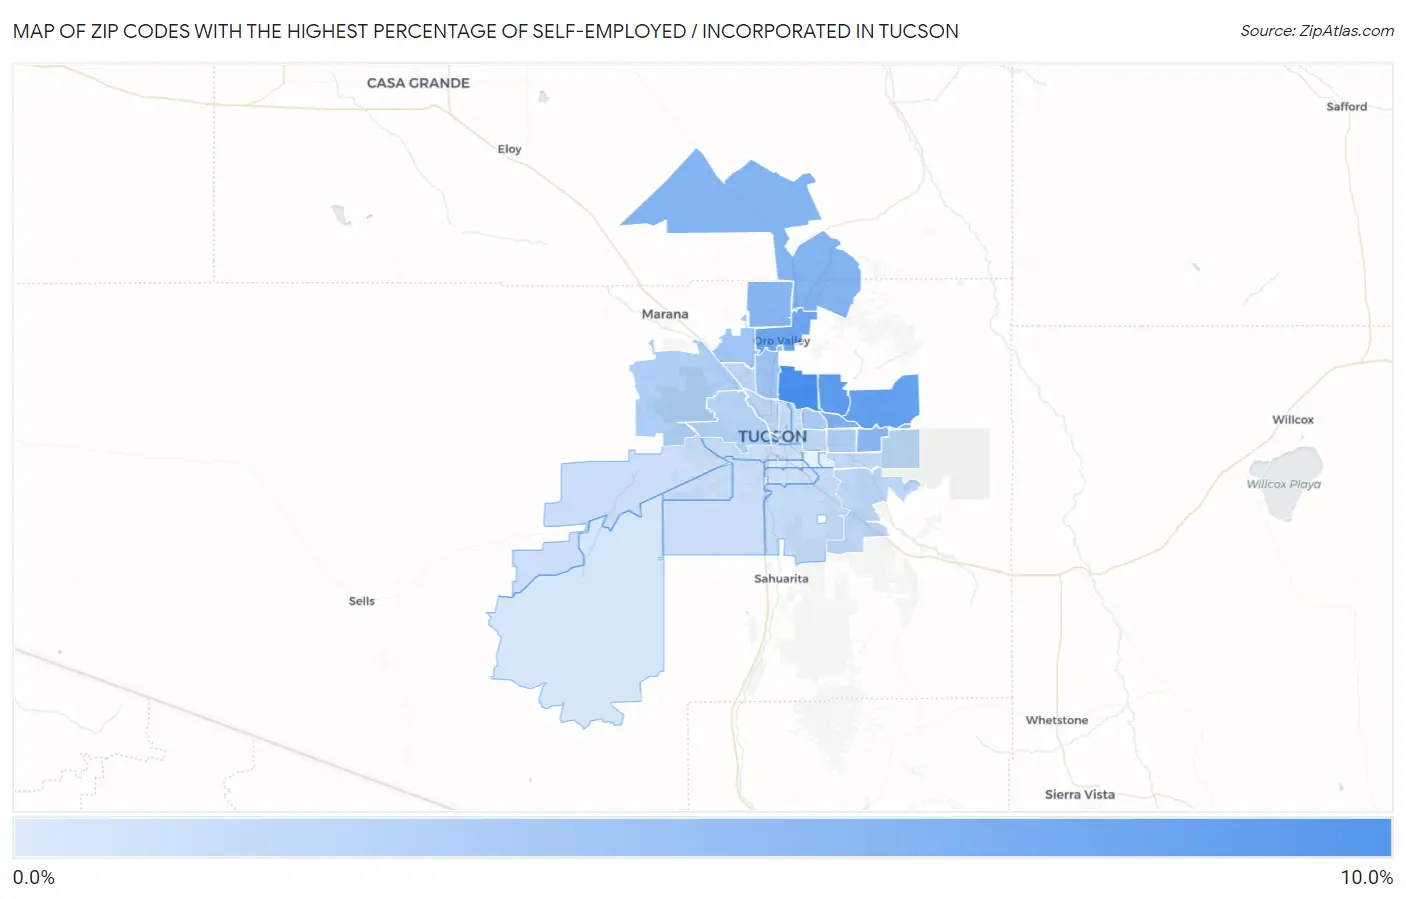
Map of Zip Codes with the Highest Percentage of Self-Employed / Incorporated in Tucson

0.0%
10.0%
Zip Codes with the Highest Percentage of Self-Employed / Incorporated in Tucson Map

Zip Codes with the Highest Percentage of Self-Employed / Incorporated in Tucson, AZ

Zip Code % Self-Employed / Incorporated vs State vs National
1.8571810.0%3.9%(+6.08)#303.8%(+6.17)#2,326
2.857508.7%3.9%(+4.82)#363.8%(+4.92)#3,055
3.857498.3%3.9%(+4.38)#383.8%(+4.48)#3,403
4.857377.5%3.9%(+3.57)#463.8%(+3.66)#4,186
5.857156.6%3.9%(+2.66)#563.8%(+2.75)#5,400
6.857396.2%3.9%(+2.29)#643.8%(+2.38)#5,966
7.857556.0%3.9%(+2.13)#673.8%(+2.23)#6,245
8.857486.0%3.9%(+2.06)#703.8%(+2.15)#6,397
9.857014.8%3.9%(+0.871)#973.8%(+0.964)#9,239
10.857044.6%3.9%(+0.696)#1053.8%(+0.789)#9,769
11.857424.4%3.9%(+0.537)#1103.8%(+0.631)#10,262
12.857123.8%3.9%(-0.075)#1353.8%(+0.019)#12,607
13.857103.6%3.9%(-0.355)#1483.8%(-0.262)#13,787
14.857433.4%3.9%(-0.527)#1573.8%(-0.434)#14,570
15.857453.2%3.9%(-0.736)#1673.8%(-0.643)#15,529
16.857472.8%3.9%(-1.09)#1873.8%(-1.000)#17,293
17.857412.8%3.9%(-1.10)#1883.8%(-1.01)#17,333
18.857052.8%3.9%(-1.15)#1903.8%(-1.05)#17,557
19.857302.5%3.9%(-1.44)#2043.8%(-1.34)#19,037
20.857112.4%3.9%(-1.46)#2063.8%(-1.37)#19,159
21.857562.2%3.9%(-1.72)#2203.8%(-1.62)#20,396
22.857572.0%3.9%(-1.86)#2333.8%(-1.77)#21,131
23.857192.0%3.9%(-1.87)#2343.8%(-1.77)#21,152
24.857162.0%3.9%(-1.88)#2353.8%(-1.79)#21,218
25.857351.9%3.9%(-1.98)#2423.8%(-1.88)#21,677
26.857461.9%3.9%(-2.02)#2443.8%(-1.93)#21,897
27.857131.7%3.9%(-2.22)#2503.8%(-2.13)#22,709
28.857061.6%3.9%(-2.27)#2543.8%(-2.17)#22,919
29.857361.3%3.9%(-2.58)#2693.8%(-2.49)#24,154
30.857140.86%3.9%(-3.05)#2893.8%(-2.96)#25,673

Common Questions

What are the Top 10 Zip Codes with the Highest Percentage of Self-Employed / Incorporated in Tucson, AZ?
Top 10 Zip Codes with the Highest Percentage of Self-Employed / Incorporated in Tucson, AZ are:
#1
10.0%
#2
8.7%
#3
8.3%
#4
7.5%
#5
6.6%
#6
6.2%
#7
6.0%
#8
6.0%
#9
4.8%
#10
4.6%
What zip code has the Highest Percentage of Self-Employed / Incorporated in Tucson, AZ?
85718 has the Highest Percentage of Self-Employed / Incorporated in Tucson, AZ with 10.0%.
What is the Percentage of Self-Employed / Incorporated in Tucson, AZ?
Percentage of Self-Employed / Incorporated in Tucson is 2.5%.
What is the Percentage of Self-Employed / Incorporated in Arizona?
Percentage of Self-Employed / Incorporated in Arizona is 3.9%.
What is the Percentage of Self-Employed / Incorporated in the United States?
Percentage of Self-Employed / Incorporated in the United States is 3.8%.